Lie to Me: Bad Metrics for Social Media
by Member of TrueSocialMetrics team ~ 6 min
The best way to screw up your social media analytics is to choose bad metrics or use them incorrectly. Here are the best ways to do it.
Non actionable metrics
Non actionable metrics it’s when you see some number and think it’s great but don’t actually know how to use it. The great example of such are Compound metrics. It’s like playing a bagpipe while riding a unicycle in a costume of Darth Vader - hard and useless, but looks cool.
Oh, yes, and I forgot the kilt.
Let’s take, for example, a heavily compound Engagement rate, usually calculated somehow like this:
Engagement rate = #Likes + #Shares + #Coffees consumed + #Circles on Saturn/ #followers
So when you know that your Engagement rate is 100 what does it actually tell you and how could you improve it? Does it shows that your last post was viral, or emotionally touching, or evoked conversation among your users? Should you create more posts of some topic to receive more shares or should just drink more coffee? The only way you can use it, is for comparison, to see if the number is bigger than the previous month. And rarely you can calculate this metric for your competitor’s pages to compare with them. But at least it looks cool.
Deceptive metrics
My personal favorite deceptive metric is the Number of Followers. This metric has deserved a whole article about its uselessness and dangerous deceptiveness. In a nutshell, the Number of followers just obscure your vision and distract attention from the problems in your social media strategy. You think that you are doing great having 100 000 followers on Facebook, but you do not take into account their activity and response to your brand (or whatever is your economic goal). And when you analyze all this, it turns out that only 4 % of these impressive 100 000 cohort actually bought something from you or at least visited your site. And other “fans” were just passing by hoping to win a free prize in your contest, or just trying to get more followers themselves, or simply were bots.
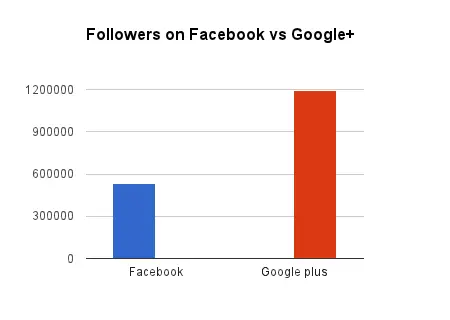
Nice example is Delta airlines pages on Facebook and Google plus. The number of followers:
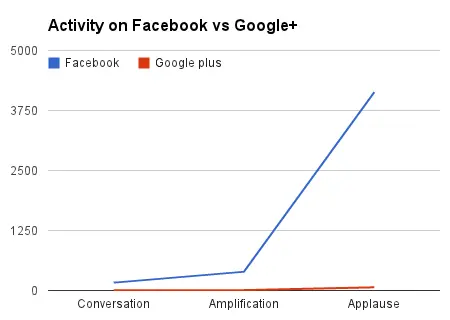
Amazing! 1,19 mln followers in Google plus is 2 times bigger than 500k on Facebook. Wait a second, and what about the activity on page:
(Conversation = Comments per post, Amplification= Shares per post, Applause = Likes per post)
Liar, liar, pants on fire. Number of Followers lie.
Jumping to conclusions
The one thing you should remember about statistics even when you forget everything else - correlation does not imply causation. I know, it’s unfair. But it simply doesn’t. For example, be careful with saying that your social media marketing is successful just by seeing a huge number of followers at your page. You don’t even know if this is followers who are causing activity on your profile / site / sales center, or is it people who don’t follow you.
Careful with averaging
Averaging is good for showing the whole picture, but be aware of the consequences. Using it when the difference among analyzed values is huge may look creepy: it’s like me and The Beatles has written 304,5 songs on average. And always have a backup plan - seeing average number of likes per post in account is good, but to make it more actionable analyze also the number of likes on each post. To get rid of awful posts ideas and amplify the good ones.
Lying with metrics
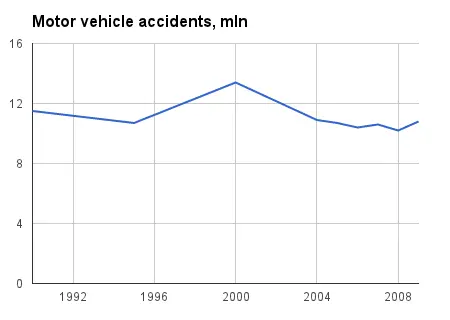
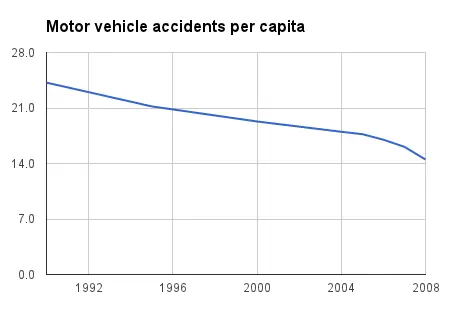
Even the Good metrics could be spoiled by using them wrong. Always be aware of the purpose and specifics of the use in each case. Choosing the relative metrics, or absolute, or averaged, when it’s needed (or not) could change the picture drastically. Using metrics the right way can even save lives. Here’s an example from the real life to make it more convincing for you.
The question rises here, does all those regulations and new laws actually help to make roads safer or simply cause inconveniences for drivers? It doesn’t look like number of accidents have actually decreased over time and even increased in some years. Should we eliminate all those strict regulations?
But when we remember that the population increases each year and calculate the relative number of accidents per capita, we have no more questions. Regulations stay - lives saved.
Whenever you are in doubt if the metric is good or not, try using Avinash Kaushik’s “Three layers of So what” test. My page’s engagement rate is 10. So what? Well, engagement (whatever it is) is great... and 10 is also good, I guess...better than 0... So what?
What really matters is measuring users’ interaction with your content, their active response and impact on your business, not simply measuring the bulk number of fans or metrics that don’t tell how to improve your marketing strategy and revenue. Due to recent researches, a value of a Fan is even lower than of a banner ads.
But don’t get depressed, there are still some Warriors of the Light left - good metrics.
Reach and Virality from Facebook insights are nice metrics - clear and actionable. Engagement is also great (clicks on post/ #number of impressions) - it’s like conversion rate of your posts. Although I would have given it more clear name, engagement could mean anything.
One more great example is 4 metrics we, here at TrueSocialMetrics, chose to measure:
Because they are:
- Simple (non compound) and clear
- Easily measurable
- Actionable
- Comparable to competitors (except economic value, unfortunately)
- Valuable for business
- Measure active and partly even passive engagement
Can you name some good metrics? Which ones do you use in your daily work? Please share your thoughts in comments.
When you’re ready to rock your social media analytics
give TrueSocialMetrics a try!
Start Trial
No credit card required.
