Google Analytics Hacks
Google Analytics (GA) is an exceptional analytical engine, but it lacks an inherent understanding of your business’s critical metrics. Whether your key online goals revolve around subscription purchases or phone calls, GA needs customization to reflect what’s most important to you. This guide will focus on how to categorize streams of data—such as visits, events, clicks, views, and scrolls—into meaningful groups to facilitate deeper and more effective analysis.

Content Group
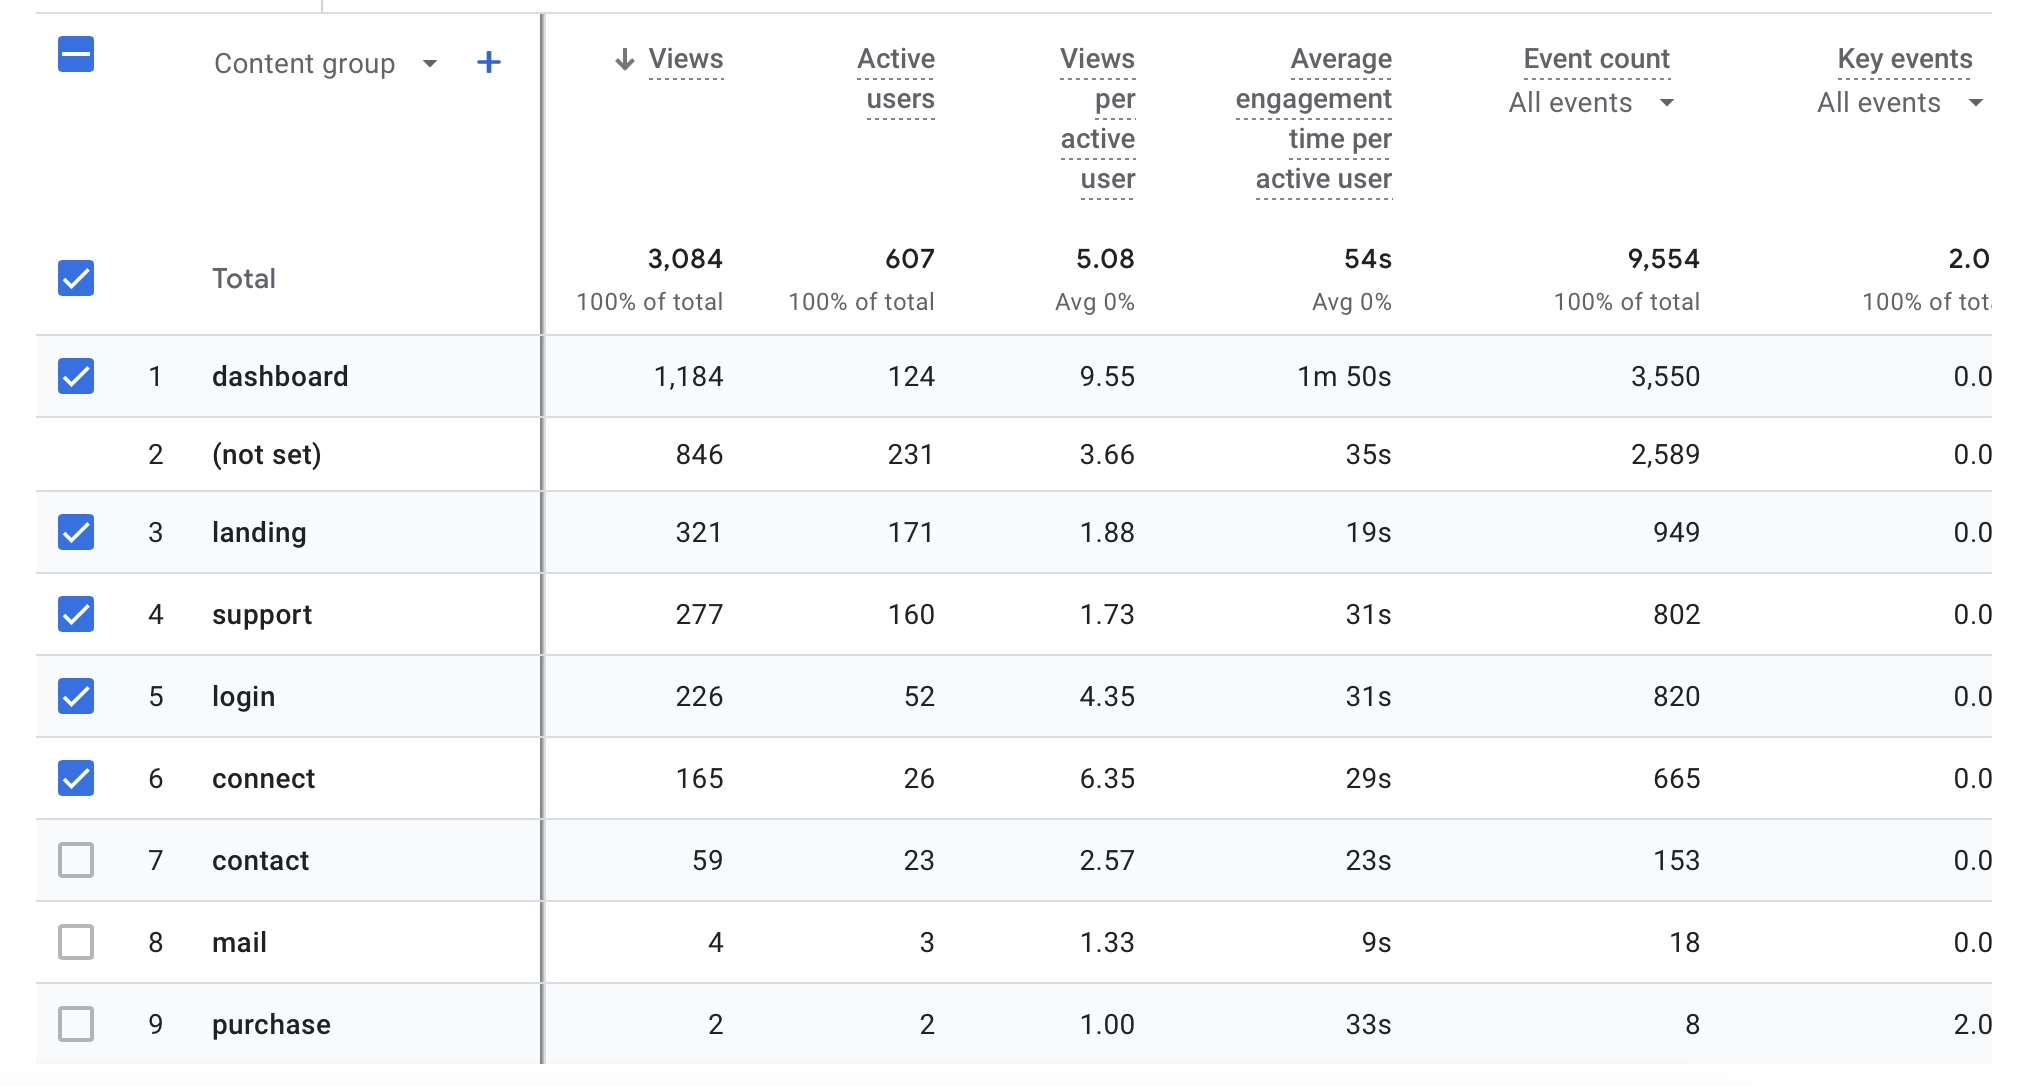
Content grouping in GA allows you to organize URLs into logical categories that make sense for your business. Instead of analyzing every individual page, you can segment them into broader groups that represent different sections of your website.
For example, on True, we use the following structure:
- /analytics, /competitors, and /segmentation are categorized as “dashboard” because these pages pertain to user analytics and business insights.
- /dev and /tableau fall under the “development” category, as these are geared toward developers seeking integration solutions with True.
- /contact and /about are categorized as “contact,” since visitors here are likely looking for information on how to reach or learn more about the company.
This method of content organization provides a clearer and more structured overview of website performance. It simplifies engagement analysis by focusing on large, meaningful blocks such as “dashboard,” “landing pages,” or “email campaigns,” rather than getting bogged down by the intricacies of hundreds of individual pages. This makes it easier to build targeted engagement funnels and measure key performance metrics across different sections of your site.
User Id
User ID is a crucial feature in Google Analytics, allowing you to track and recognize individual users across different devices and sessions. This is particularly valuable if your users sign in on multiple devices, such as desktops, tablets, mobile phones, or within your app. By assigning the same user ID to a person across devices, GA can consolidate these sessions into a unified user profile.
This unified view is essential for understanding customer behavior across multiple touchpoints. For example, you can track a user’s journey from a paid ad campaign to a direct visit or a referral link. By seeing the entire interaction path, you can identify the first point of contact, allowing you to make better-informed decisions on where to allocate your marketing resources. This insight enables you to invest more strategically in channels that drive initial interest or high conversions.
User Properties
User properties are often underutilized but can be incredibly powerful, especially for businesses with subscription-based models or long customer engagement cycles, such as apps or games. Google Analytics allows you to set up to 25 custom user properties, enabling highly specific tracking and segmentation.
For example, on True, we use the following structure for user properties:
user_properties: {
	subscription: "enterprise", // type of subsription
	customer_type: "owner" // or member
}
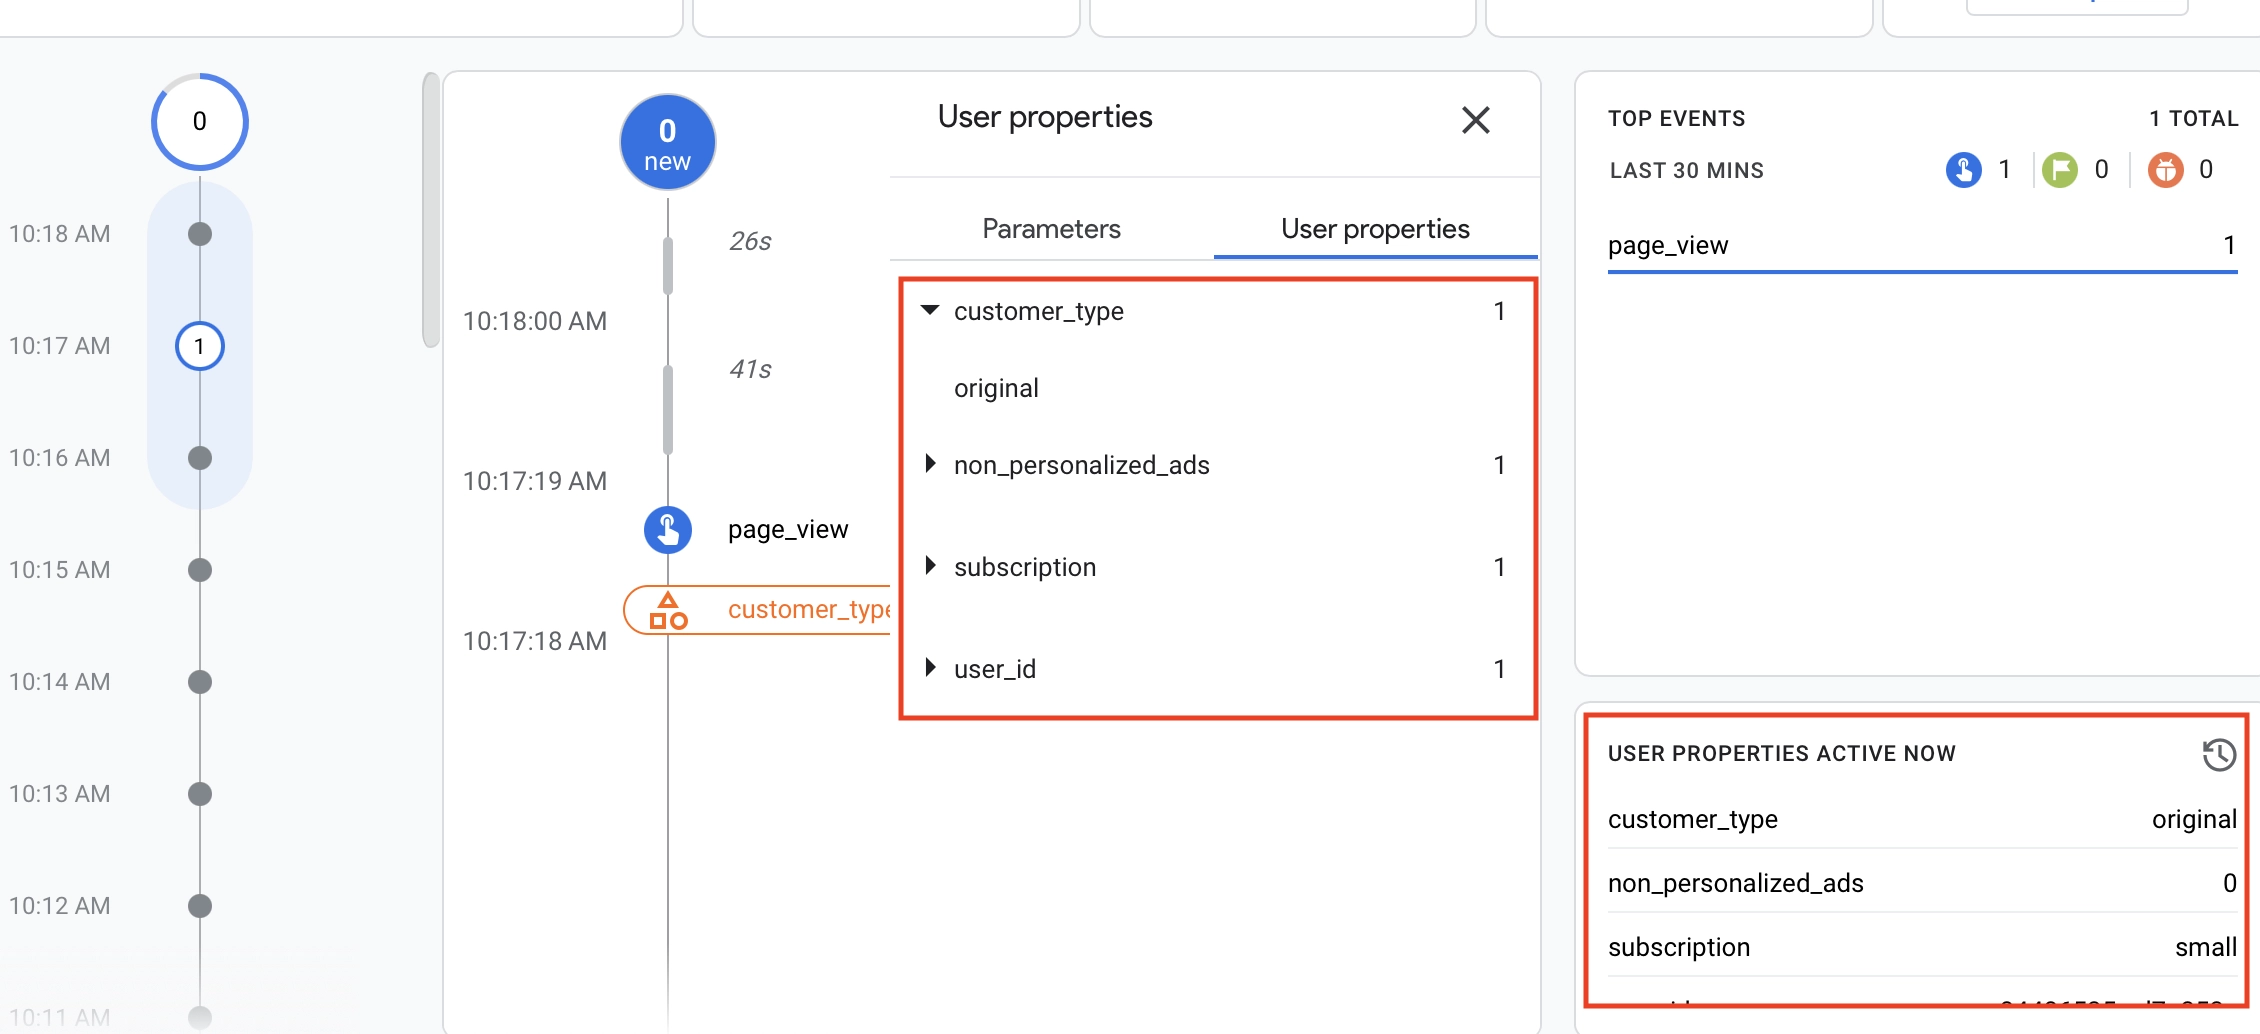
With these properties in place, it’s easy to segment users based on subscription type, behavior, and engagement patterns. We can filter the data to study how enterprise subscribers behave differently from users with a standard plan. Similarly, the customer_type property distinguishes between the primary account owner and a team member, helping us understand which features are more important to different types of users.
The Realtime report provides a useful, at-a-glance view of these user properties. While Realtime is primarily used for debugging, it can also give valuable insights into how different types of users are interacting with your site. Beyond debugging, these properties can be applied across various reports to filter traffic, build funnels, and analyze behavior based on user segmentation.
User Experince Metrics: Page Generation Time & Page Load Time
Page generation time in Google Analytics can be broken down into two primary categories:
There's a list of times but the 2 main categories are:
- page_generation_time - Server-side performance: This measures how quickly your server can generate web pages. It reflects the speed of your web server and database, identifying any heavy pages or bottlenecks that your development team should optimize.
- page_load_time - Client-side performance: This category measures how quickly a page is loaded from the user’s perspective. Factors such as connection speed, DNS request time, and latency affect page load times. The most critical metric here is how long it takes to generate the web page once the server has processed the request.
By analyzing page generation time, you can identify bottlenecks that cause users to abandon your site or app. For example, if your server-side performance is slow, it may indicate the need for server optimization or database tuning. On the client side, excessive page load times may result in higher bounce rates, making it crucial to address issues like connection time or web page rendering speed.

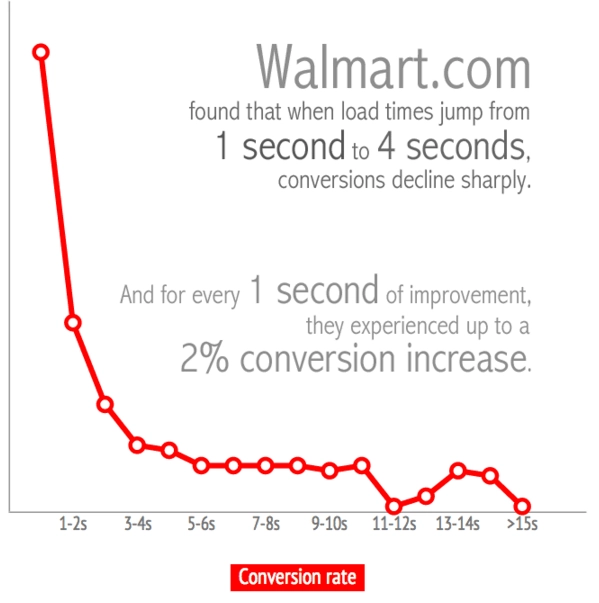
As the image above illustrates, even minor improvements in page load time can lead to significant increases in conversion rates. Therefore, understanding and optimizing page generation time is vital for improving both user experience and business outcomes.
On True we use simple code, to put all trhe necessary varibales to Google Analytics
<script type="text/javascript">window.gaConfig={
    "user_id": "random-user-id-you-generated",
    "content_group": "landing",
    "page_generation_time": 19,
    "user_properties": {
    	"subscription": "small",
    	"customer_type": "member"
    }
};</script>
<script defer="defer" src="/js/ga.js"></script>
And then in ga.js
if(element.getElementById('gajavascriptscript') === null) {
	let script = element.createElement('script');
	script.setAttribute('src', 'https://www.googletagmanager.com/gtag/js?id=G-XXXXXXXX');
	script.setAttribute('id', 'gajavascriptscript');
	element.body.appendChild(script);

	// now wait for it to load...
	script.onload = () => {
	  window.dataLayer = window.dataLayer || [];
	  function gtag(){dataLayer.push(arguments);}
	  gtag('js', new Date());
	  gtag('config', 'G-XXXXXXXX', window.gaConfig);
	  gtag('event', 'page_generation_time', {value: window.gaConfig.page_generation_time});
	  gtag('event', 'page_load_time', {value: Date.now() - window.performance.timing.navigationStart});
	};
}
The code loads gtag.js from GoogleAnalytics and after it was loaded runs code that submit page_generation_time and page_load_time to GA.

As seen in the chart, the Page Generation Time is nearly zero for most pages, except for the /setting/account page. This indicates that the backend processing for the majority of pages is highly efficient. However, the Average Page Load Time, which depends on the visitor's network and browser performance, shows slightly higher values, ranging from 0.5 to 1.2 seconds. These are excellent results, reflecting significant effort and optimization.
That said, I am particularly concerned about the Average Page Generation Time of 0.2 seconds. While this might seem small, it suggests that some pages are taking an unusually long time to load on the server side. These outliers could represent potential bottlenecks in the application. Investigating and resolving these anomalies would be crucial to ensure consistent performance across all pages.
By focusing on pages with higher generation times, like /setting/account, we can pinpoint the specific areas in need of optimization. These improvements may involve reducing database query complexity, optimizing server-side processing, or addressing any inefficient code paths. Doing so will further enhance the application's overall performance and user experience.
When you’re ready to rock your social media analytics
give TrueSocialMetrics a try!
Start Trial
No credit card required.


