Google Plus Communities Analytics: Social Media Communities
by Member of TrueSocialMetrics team ~ 5 min

If you run a community on Google+, or are simply trying to choose the best community to participate in, analyzing the activity level inside communities will come in handy.
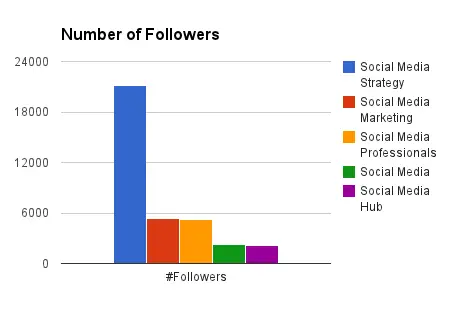
Let’s take, for example, 5 communities for social media professionals. I’ve arranged them by the number of followers (in descending order from left to right), and color coded them for convenience. The period of study was April 1-10, 2013. The tools used were TrueSocialMetrics and Google Drive (for graphs).

When you choose which community to participate in, or compare your own community with competitive communities, you usually look at the number of followers. The more, the better. But in practice, this is not always the best comparison. What really matters is how active the communities are because nobody likes unresponsive communities.
This is in contrast to the followers’ activity inside the communities:
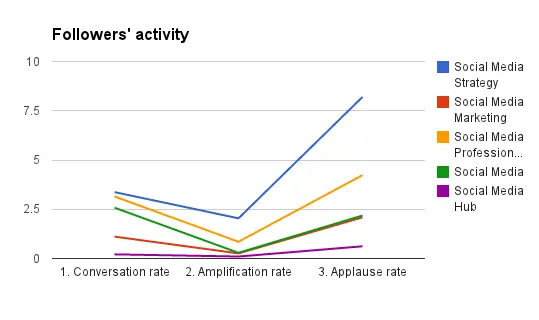
Note: Conversation rate - #comments per post, Amplification rate - #shares per post, Applause rate - #likes per post. More about these metrics.
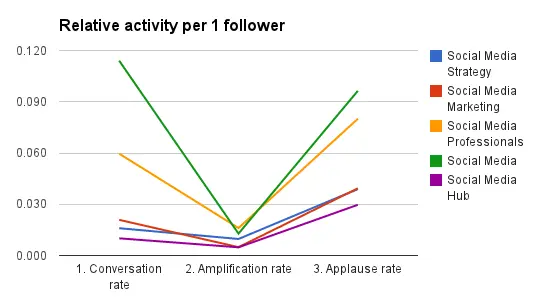
Although, Social Media Marketing community (the red one) is the second from the top based on the number of followers, it’s second from the bottom based on their activity. In this case, it’s better to use relative metrics per 1 follower to see which community is doing a better job at engaging their followers.
Activity could also be measured according to the posting density, i.e. the number of posts during the study period.
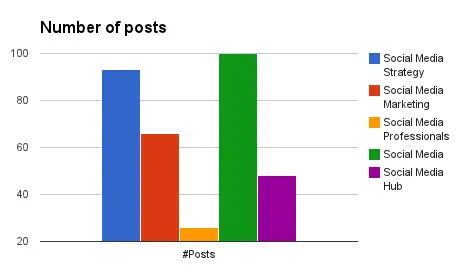
Social Media Marketing (red) had 2.5 times more posts than Social Media Professionals (yellow), with equal amount of followers. So Social Media Marketing’s followers need 2.5 times more time and effort to respond to all posts, which is why the activity is lower in this community. What this means is that you need to work a bit harder in the Social Media Marketing community than in the Social Media Professionals community to get your posts noticed. On the other hand, in the Social Media Marketing community you will have more content to read from others.
As for the other communities:
Social Media Strategy (blue) has the highest number of followers, 4 times more than, for example, Social Media Professionals (yellow), but it has only 2 times more activity in absolute numbers. Сrowded communities could provide more exposure, but require more work to get noticed and receive some feedback, and your posts will move quickly from the juicy top positions in the feed to the obsolete bottom.
Social Media Professionals (yellow) post less often, but have a very nice activity and engaged followers. Having fewer posts could be an upside sometimes, since there’s a higher possibility that your post would be noticed by the members and receive feedback.
Social Media (green) has the same number of followers as Social Media Hub (purple), however their 2000 followers are much more active. And that’s both in relative terms of activity per 1 follower and in terms of the posts density - 2 times more posts in Social Media (green) than on Social Media Hub (purple).
For community owners, one more useful thing to analyze is the per post activity to reward the best performers, e.g. with a ‘Best Post of the Month’ award, and so on. This would help to increase followers motivation and help to understand which topics they prefer. This one is from the Social Media community:
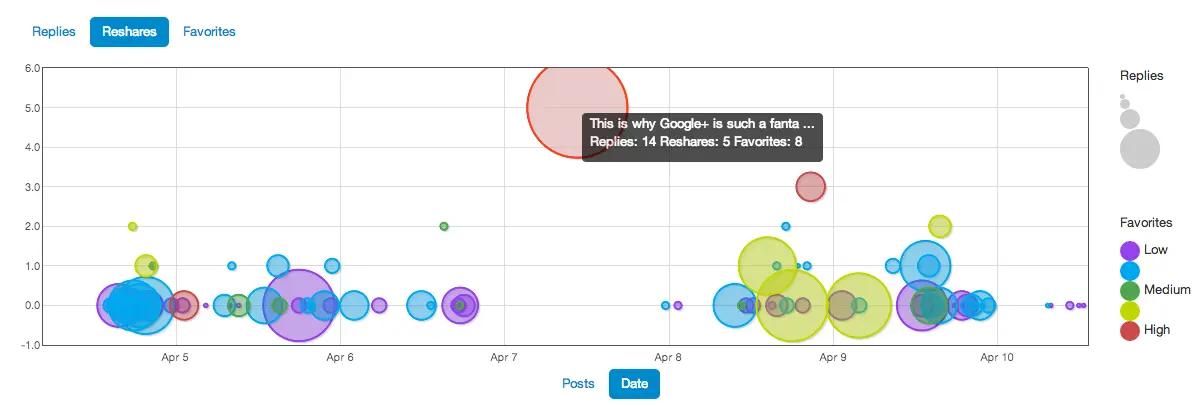

Notice the interesting pattern of posting activity. This winning post was the only one posted on Sunday (April 7), and as such was fully rewarded with higher response.
And the one from Social Media Strategy:
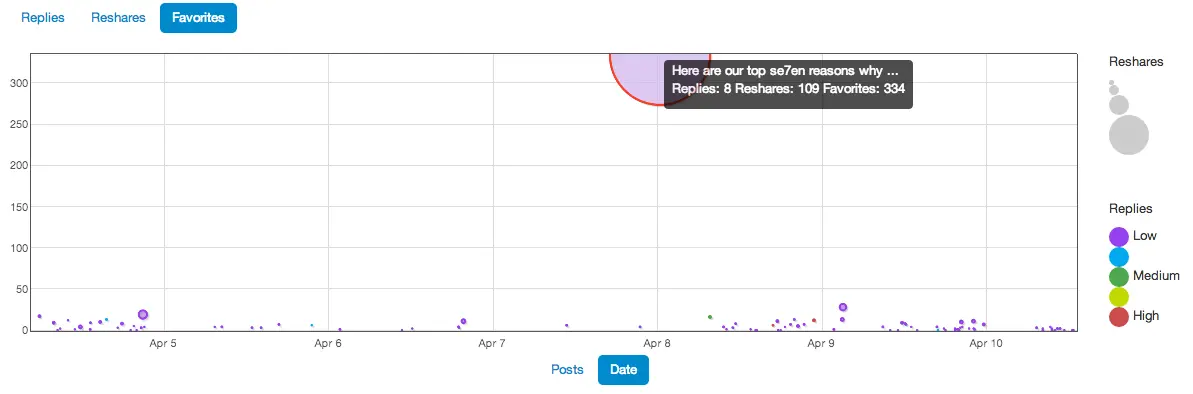

Look at that Goliath! Other posts are just miniscule when compared to it. And an interesting thing is that it was posted on a Monday (April 8).
The curious pattern here is that both messages were posted on Sunday-Monday (I guess different followers’ timezones explain the Sunday success, although Monday is traditionally considered as the best time to post) and both are about Google+. Can we call the followers of Google+ Communities patriotic? :)
Analyzing communities is easy, fun, and free to do. Different communities have different pros and cons, so whenever you assess them, try looking a bit deeper than just the number of followers.
When you’re ready to rock your social media analytics
give TrueSocialMetrics a try!
Start Trial
No credit card required.
Continue reading
How Oreo Rocks in Twitter: Using Content Segmentation for Tweets Analysis

DoubleTree Hotels on Facebook: Benchmarking from Fellow-brands

Why You Need Social Media Analytics Tools for Your Business

10 Tiny TrueSocialMetrics Tweaks to Save More Time On Your Social Media Analytics
