Conversation / Amplification / Applause Rates Usage Best Practices
by Member of TrueSocialMetrics team ~ 4 min
Analyzing metrics at Page Level
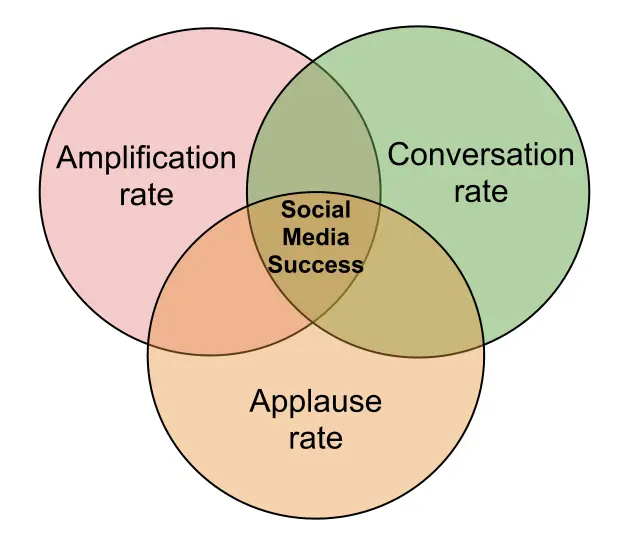
Calculating Conversation / Amplification / Applause rates at Page level will help you measure the active engagement of users with your Social Media pages. Did your posts evoke conversations, encourage to share your information, induce to Like the valuable content.
Analyzing these metrics on page level will help you see the main tendency in your posts performance. Seeing disproportion can help find problems. For example, seeing that Conversation rate is huge, but Amplification and Applause rates are miniscule is an alarming sign. Why do people Comment a lot but do not Like or Share your content? Commenting is much harder than simply pressing a Like button. If people don’t Like your posts but Comment on them than these are probably negative comments. E.g. in case of Papa John’s Pizza people used their brand page mostly for complaints. And seeing disproportion described above helped to discover that.
You can analyze these metrics at Metric page.
Analyzing metrics at Post Level
By analyzing Conversation / Amplification / Applause at Post level you will be able to find out which topics work the best for engaging your followers. Which topics are the best for triggering a conversation, which ones people are more willing to share, and what themes has more chances to be liked. You can analyze this at Diagnostic page.
In addition to that, you can find out your Best Post Ratio (your best performing post results) for each social media to make it your Golden Standard. Of course it should be used with an eye on your competitors’ results, nobody wants to set up a low standards.
Comparing to Competitors
The best way to know if your results are good or not is to compare them to your closest competitors’ results. You can do it easily on True because no login credentials are required when connecting accounts you don’t own.
Read more how to conduct сompetitors' analysis on True here.
Comparing to an Industry standard
Another great way to use external context to evaluate your results is to compare them against Industry standards.
Use Indusrty standards report to do it.
#### Averaging metrics by the Number of Followers
Why is this important? Because having 50 Likes per Post with 500 Followers is a great achievement, but having the same 50 Likes per Post with 5 mln Followers is a great defeat. Plus to that, you and your competitors definitely have different Number of Followers and to accurately compare your results this should be taken into account. That’s why it is helpful to calculate Relative metrics per 1/10/100/1000 Followers.
Here’s an example of the calculation for Pizza Hut in Facebook:
Relative Conversation rate = (312/8083591)*100 = 0,004
where: Conversation rate = 312, Number of Fans = 8083591
It means that on average 100 Fans leave 0,004 Comments to 1 Post. The lower this ratio, the more inactive Followers your account has (or the worse content). The same ratio for their competitor Domino’s Pizza is 0,002 - now we can see that Pizza Hut is doing better at engaging their Fans or simply has more active Fans. (Note: the data in example is not up-to-date and doesn’t show the real state of things for these two brands for today).
This data will show you that either your content in Social Media should be improved or your Followers acquisition strategy (maybe you are trying to attract not your target audience). And who is doing a better job at engaging the Followers you or your competitors.
You can calculate these metrics automaticly at Relative metrics page.
You can find an examples of the mentioned best usage practices at our case studies.
When you’re ready to rock your social media analytics
give TrueSocialMetrics a try!
Start Trial
No credit card required.
Continue reading
AB Testing with Google Analytics and Event Tracking

Why Measuring the Number of Followers is a Bad Idea

Rolling Out Pinterest Analytics for Everyone

- We are moving to new Pinterest api.
- Pinterest will be available for everyone, for all plans.
- Google+ communities and Vine analytics will be discontinued.
- Premium plans will be discontinued (plans that include Pinterest/Vine/Google+ communities).
Static Files as a Database
