How to Analyze a Pinterest Account: Step-by-step Guide
by Member of TrueSocialMetrics team ~ 5 min
As you may already heard Pinterest analytics is now available on TrueSocialMetrics. Customers on Small Premium, Medium Premium and Agency Premium plans can now analyze all personal or business Pinterest accounts with no login credentials required.
Here’s a step by step guide on how to analyze a Pinterest account and its competitors.
1. Analyze the overall performance.
To see the big picture of where Pinterest stands in your social media strategy, compare your Pinterest account results with your pages in other social networks. And find out which social network tends to be more effective for your brand.
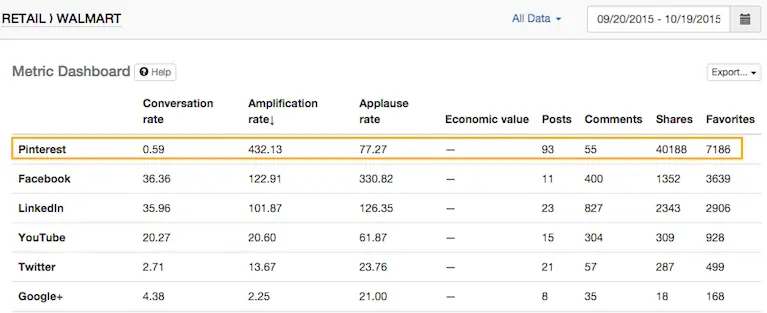
Report to use: Metrics
Example: For Walmart, Pinterest is the most viral social media source, beating 5 other social networks by the Amplification rate (Number of Shares per Post).
Take a look at the Trends report to see how the Followers’ activity changed over time, how it was influenced by holidays, seasonal changes, and your campaigns.
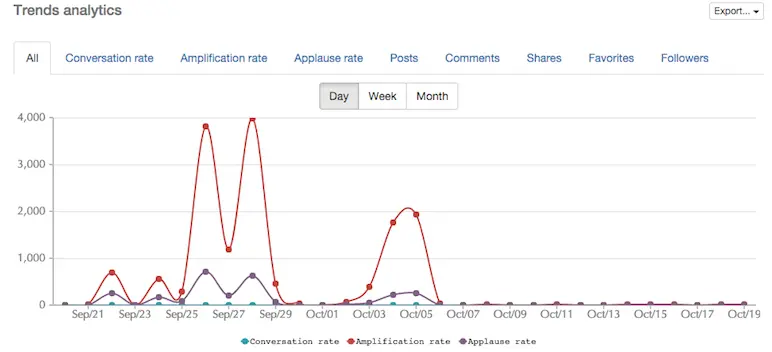
Report to use: Trend
Example: Walmart had several spikes of repinning (Amplification rate = Repins/Pin went high) caused by some super viral pins.
2. See where you stand in the Industry and among Competitors.
Use an external context to see if your results are good or bad compared to others by studying an Industry Standard in your country and all around the world.
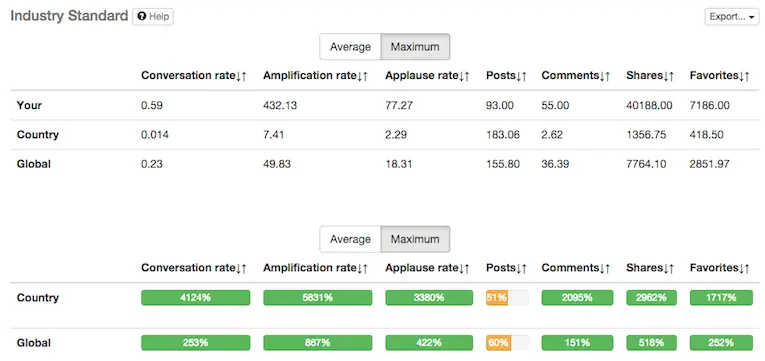
Report to use: Industry Standard
Example: Walmart Pinterest account has astounding results, beating both US and worldwide Average Industry Standard by all types of social interactions.
For more targeted (related) results, use Competitive Analysis to weigh your stats against several of your closest rivals.
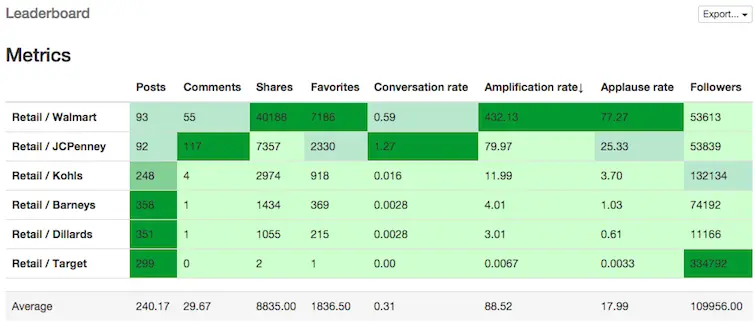
Report to use: Competitors leaderboard
Example: Walmart has the highest Amplification (Repins per Pin) and Applause (Likes per Pin) rates among top 6 retailers on Pinterest. Target totally loses the battle - having the biggest number of Followers but extensively lower number of engagements among 6 brands.
3. Analyze your Content.
Analyze how effective your content strategy is at this point by looking at the % of ‘Dead posts’ in your account - absolutely ineffective pins with 0 Likes, Comments, and Repins. And see how it diverges from the results or your closest rivals.
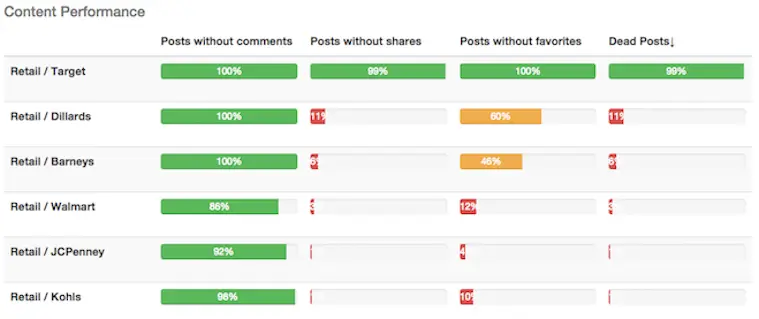
Report to use: Content Performance
Example: Kohl’s is the winner with only 1% of absolutely unengaging pins and Target is totally defeated with outraging 99% of unengaging pins.
Study your Posting Density effectiveness: How often you and your competitors post and how much engagement everyone gets - taking into account the Number of Followers. If posting a lot but not getting enough engagement: You may be spending a lot of resources on content creation in vain, because you are posting too much and followers don’t have enough time to engage with all the pins; or you are missing the best time to post; or your content ideas are not appealing to your fans.
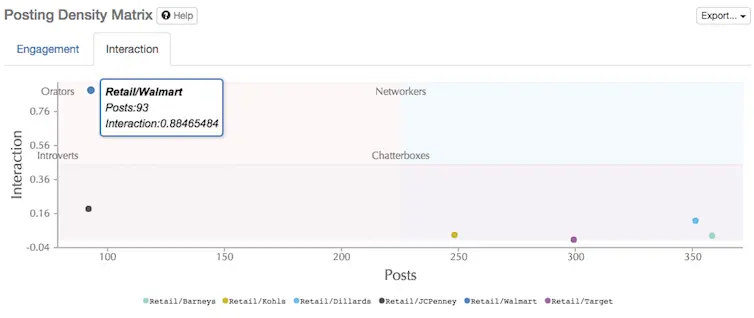
Report to use: Posting Density matrix
Example: Walmart is a true orator: While posting less than 100 pins per month (compared to 250-300 pins/month by other brands) they get more than 5 times more social interactions than all 5 other brands - taking into account the Number of Followers for each brand.
4. Gather ideas for improvement.
Look at the best and worst pins among your competition and your own account to steal some great ideas from rivals and learn from their mistakes.
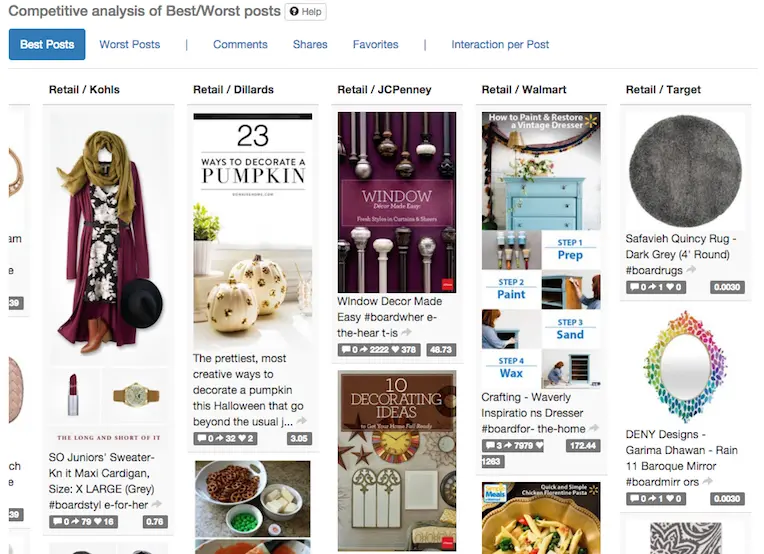
Report to use: Competitive analysis of Best/Worst posts
Example: WalMart's best posts show that cooking receipts and visual step-by-step guides tend to resonate with brands’ fans on Pinterest.
Take a look at the Best time to post report to increase the activity within your account. Compare ‘Current posting’ tab (time when you post now) with the ‘Engagement’ tab (best time to post) to see if you are missing the sweet spot.
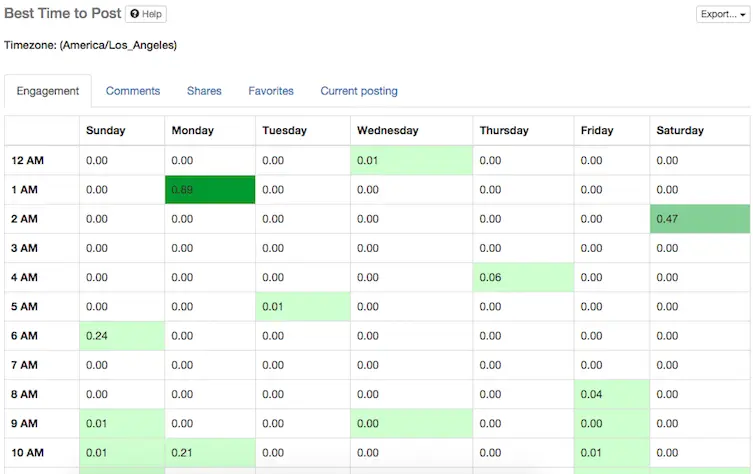
Report to use: Time to Post
Example: WalMart's suggested most effective time to post is 1AM PST.
And when analysis is finished - Good job! Now you know all about your Pinterest presence and see the ways how you can improve it.
On your mark, get set, Analyze!
P.S. If you have any questions, need a demo, or just like to have a chat, give us a shout. We can’t wait to hear what you think about our Pinterest analytics.
When you’re ready to rock your social media analytics
give TrueSocialMetrics a try!
Start Trial
No credit card required.
