How Oreo Rocks in Twitter: Using Content Segmentation for Tweets Analysis
by Member of TrueSocialMetrics team ~ 7 min
Oreo has one of the most active and effective social media strategies, which has earned them several awards in the past. We have already analyzed their winning Facebook campaign, so now let’s look at their Twitter account to study the content and benchmark some great ideas from this super cookie. We’ll use Segmentation - the King of analysis and the fastest way to uncover the truth about what works in your content strategy and what doesn’t.
Twitter campaigns/hashtags analytics
Oreo has a great practice of creating mini content series and marking these series with creative hashtags. Let’s analyze and compare these mini ‘campaigns’ and find out how effective are they.
Analyzed time frame: Summer-Winter (June 1, 2013 to February 28, 2014). I have selected five mini content series that each contain a similar number of posts to give us a more accurate comparison.
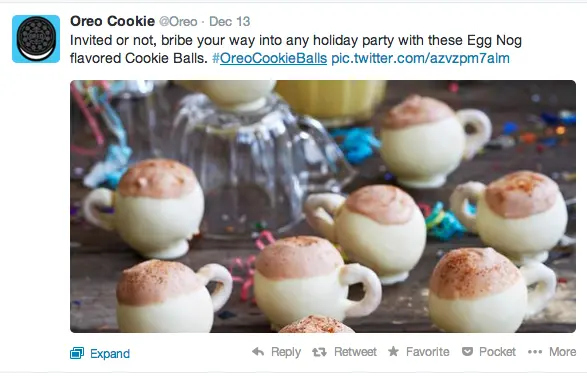
- Oreo Cookie Balls - Christmas inspired pictures of funny shaped holiday cookie balls:
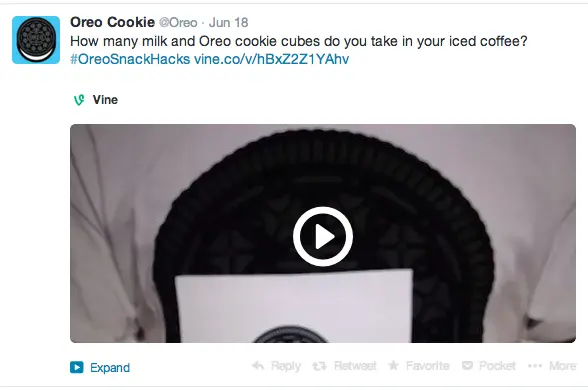
- Oreo Snack Hacks - Vine videos with funny hacks about Oreo:
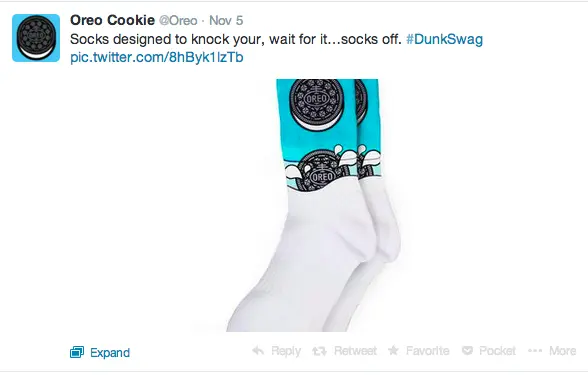
- Dunk Swag - featuring wearable Oreo souvenirs:
- Oreo Deep Thoughts - amusing Oreo-transformed idioms, mostly with no pics:
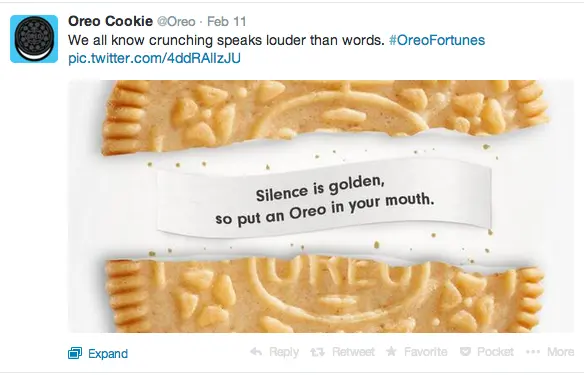
- Oreo Fortunes - fortune telling tweets with pics:
Let’s compare these mini content series against each other to find the winners:
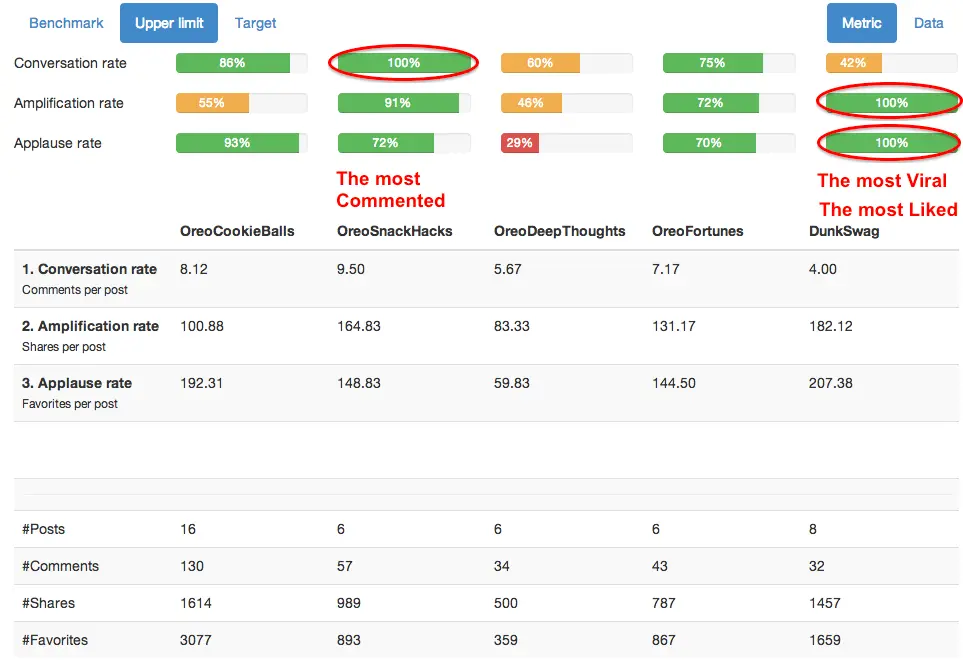
Performed with with Content Segmentation report
Oreo Snack Hacks wins the Most Commented campaign nomination. It looks like creative hacks is a good conversation starter.
Dunk Swag appears to be the Most Viral and Liked series. Funny pics were always likely to create good viral posts.
Oreo Deep Thoughts turns out to be the least successful campaign in all aspects. It looks like plain text tweets, even if really creative, aren’t as entertaining as awesome funny pics and videos.
And now let’s find out how these campaigns outperform (or not) all the rest of their social media content. Here we’ll define the rest of the content as tweets that don’t contain hashtags, and while that’s not a super perfect definition of the usual-non-campaign posts, it’s pretty close to reality. Let’s also remove Oreo Deep Thoughts from comparison since it was the least effective campaign. Okay, here we go:
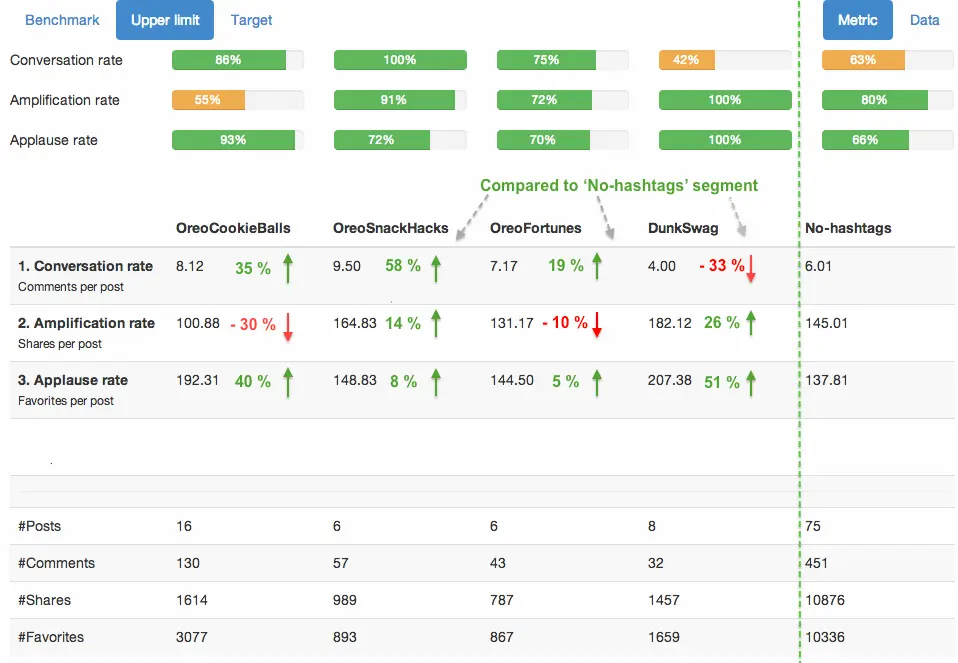
Performed with Content Segmentation report
Hoped to find some sensation here? Not gonna happen. Even their regular content is doing OK. When every tweet is a good performer, this is a sign of a good content strategy. There are no one-in-a-month super-star tweets with the rest of the tweets being losers. The only disadvantage here is that it’s a little boring to analyze when everything is doing great :)
Comparing campaigns in Twitter vs YouTube
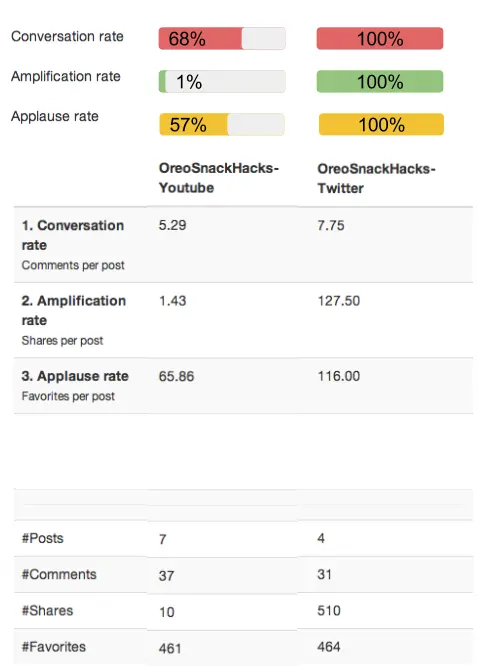
How about comparing the same campaign in different social networks? Oreo Snack Hacks is a perfect candidate since it contains videos and could be analyzed both on Twitter and YouTube.
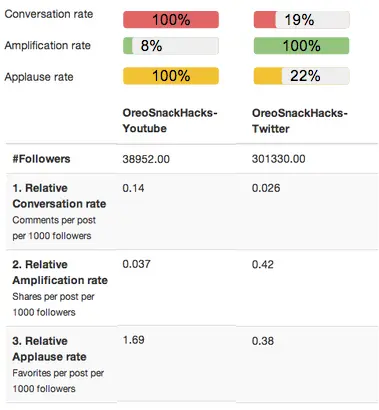
In absolute terms Twitter wins. But it’s important to note that there are different numbers of Followers between the Twitter and YouTube accounts. So let’s take this difference into account and calculate the Relative metrics per 1000 Followers for an accurate comparison.
Even in relative terms per 1000 followers, Twitter wins for virality (Relative Amplification rate), but YouTube beats Twitter for Relative Conversation rate and Relative Applause rate. This clearly demonstrates that different social networks create different responses - Twitter is geared for sharing, while YouTube is geared for conversations.
Content types analytics
Let’s compare the types of posts:
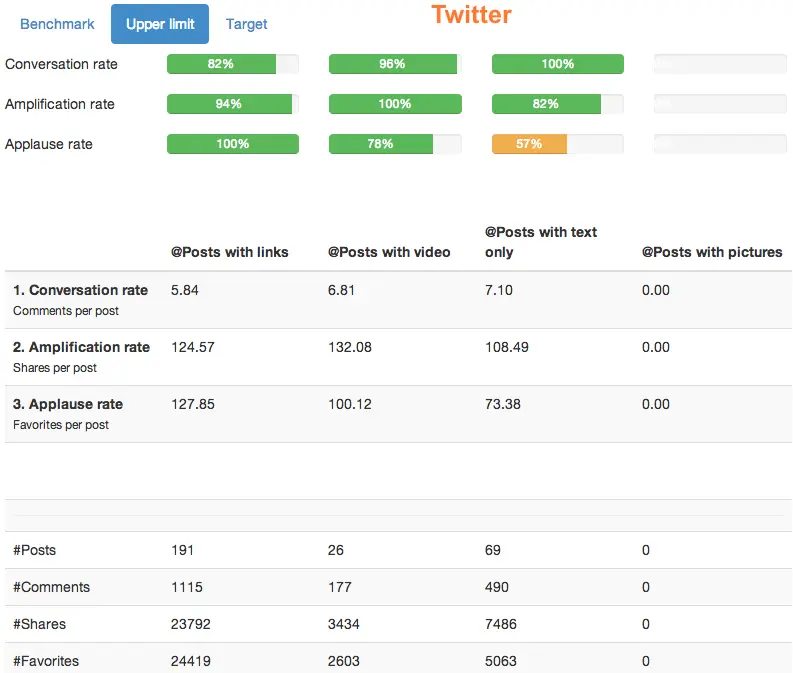
Performed with Content Segmentation report
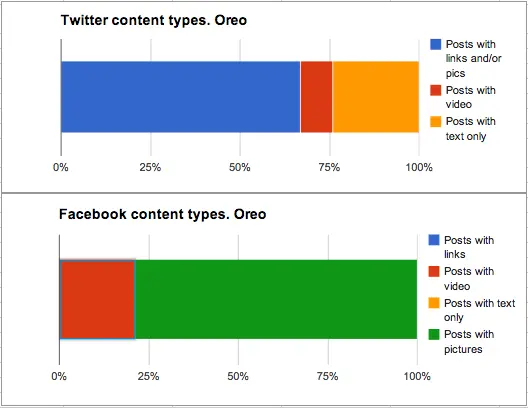
In this case, it’s impossible to separate tweets with pics because Oreo uses a smarty-pants technique to attach pics to tweets - Twitter cards. When they post a link, pictures are extracted automatically from meta-tags and are attached to tweets. Good for them, but not so good for our analysis :) Anyway, we can see that all types of content perform almost equally well in Twitter (we assume that the ‘Posts with links’ segment also contains tweets with pics).
Of course, different kinds of content perform better on different social networks. So, to satisfy our curiosity, let’s compare Oreo’s content structure for Twitter and Facebook.
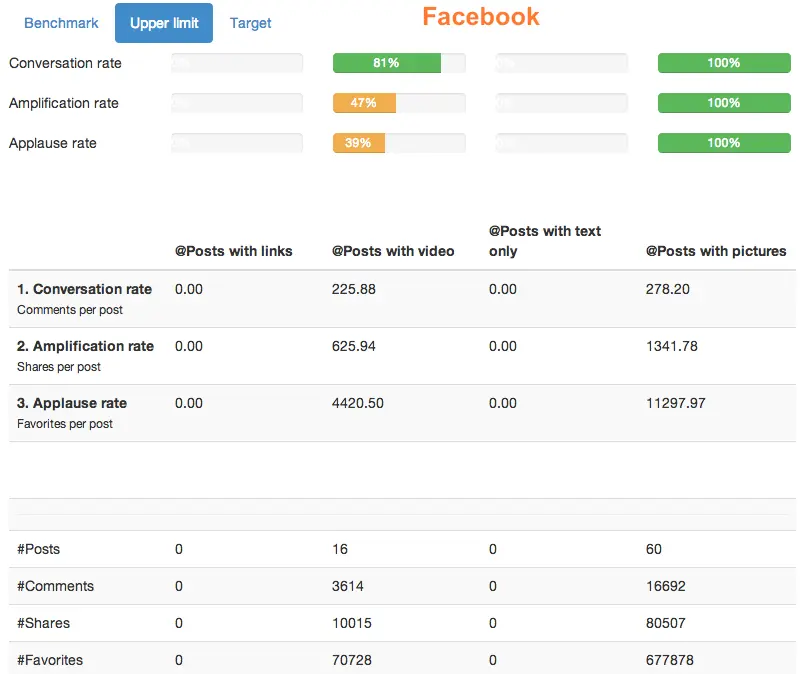
Performed with Content Segmentation report
In Facebook, there are no posts with links and no plain text posts at all. And strangely, pics are performing better than videos. Here’s how posts categorized by content type looks for both social networks:
It’s a good thing that 79% of Oreo’s posts on Facebook have pictures, since these are their most engaging posts
Owned vs Rented content
Another useful aspect to analyze is the proportion between Owned and Rented content: that is the difference between the brand’s Own posts vs Retweets. Current evidence shows that for all types of brands, industries and countries, there is one common rule - retweets perform worse than a brand’s own content. The only question now is to work out by just how much worse.
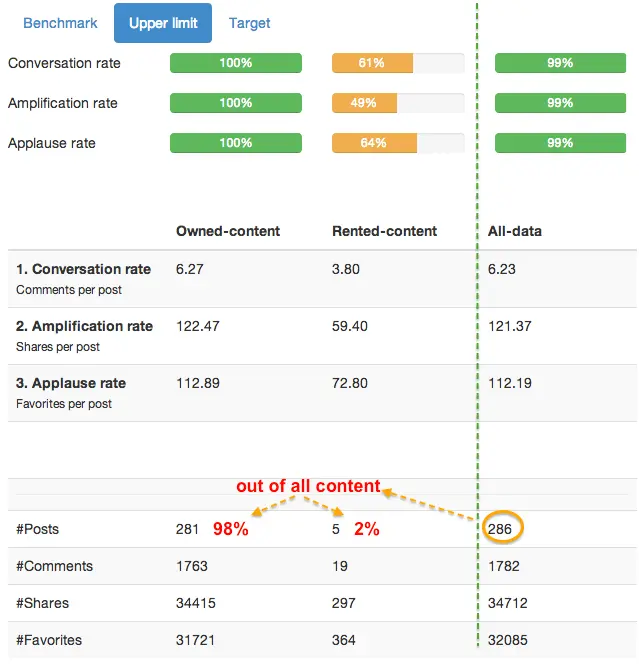
Performed with Content Segmentation report
It’s great to see that Oreo’s Rented content isn’t as bad as it could have been. Retweets are only 1.5-2 times worse in performance when compared to the Owned content. And it’s good that Oreo keeps a really nice proportion between Owned and Rented - only 2% of their content is Retweets.
Out of curiosity, let’s compare Oreo’s worst posts (Retweets) performance with the Food and Beverages Industry Standard for all tweets:
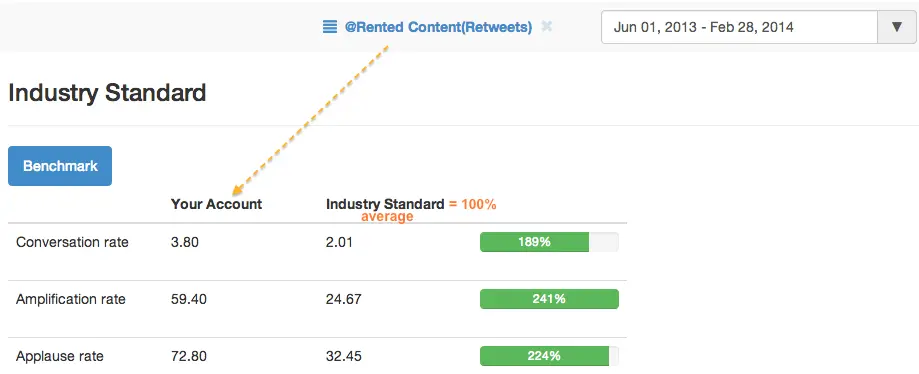
Performed with Industry standard report
Wow, even their worst posts are 2 times better than the Industry Standard for all posts.
Comparing to Industry Standard
Oreo’s content techniques are great, but we have no idea just how great they are until we put them in context. So let’s take a look at how Oreo’s tweets are performing compared to the Industry Standard:
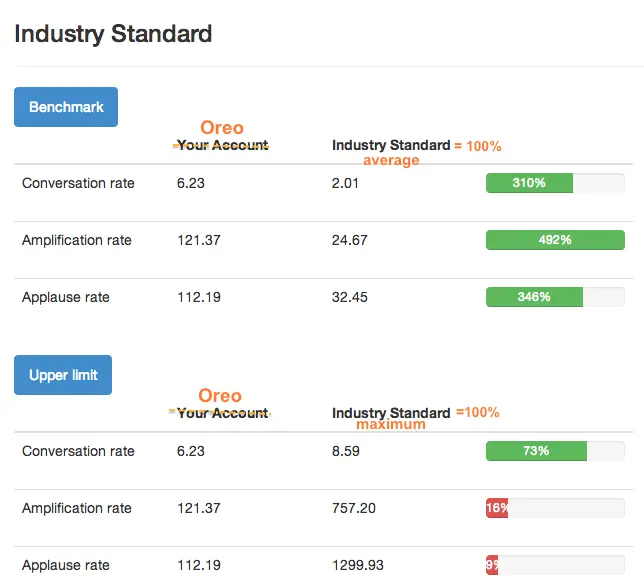
Performed with Industry standard report
As expected, Oreo are doing great when compared to the average Industry Standard: they are 3-4 times higher than average. But there is still some way to go to outgrow the maximum Industry Standard. Of course, the Foods and Beverages Industry is huge and include brands that cannot realistically compete with each other, but it’s always good to see the whole picture and have a higher bar in mind.
So at the end of the day, what can we learn from this super-social cookie-brand?
- A creative mini content series is a good way to entertain followers and will help you to more easily find ideas for your next posts.
- Keeping the number of Retweets to minimum pays off due to their lower performance.
- Find out which content types work the best for each social network and don’t waste your time on other types.
- When running and analyzing the same campaign on a different social network, make sure you take into account the specifics of each source.
So, next time you eat an Oreo, remember how awesome their Twitter strategy is. It will make your cookie taste even better. Well, it worked for me :)
When you’re ready to rock your social media analytics
give TrueSocialMetrics a try!
Start Trial
No credit card required.
