Analyzing The Best Facebook Campaigns 2012
by Member of TrueSocialMetrics team ~ 8 min
It’s always interesting to learn the best practices of the top performers. But even more interesting is knowing what’s going on behind the official results of the best social media campaigns. What happened after the successful activity? What creative techniques were used to engage followers? By what extent has the page outperformed during the campaign period and by which kinds of activity - shares, likes, comments?
Let’s analyze the 3 best Facebook campaigns of Facebook Studio 2013 award winners, one from each category - the Absolute Winner (Blue award), Gold Winner and Silver Winner. And let us find some remarkable trends.
Oreo Daily Twist
Award: The Blue Award - absolute winner.
Duration: 100 days (25 Jun’12 - 2 Oct’12).
Description: 00 Facebook page post ads in 100 days, tied to famous events like the Olympic Games, Pirate Day, the Emmy Awards, and the Mars Rover landing.
Results: Number of Facebook fans increased from 26 to 27 million. Campaign triggered over 1.3 million Facebook interactions (Shares, Likes, Comments) — an increase of 195% compared to the three months prior to the Daily Twist. Share rate increased by 280%, with each post being shared approximately 1,472 times (you can read more about this campaign here).
It’s interesting to see what happend on Oreo’s Facebook page during the Daily Twist. Let’s look at its performance through Apr 1 ‘12 till Jan 31 ‘13 (the campaign period is highlighted by a yellowish zone):

Performed with with Сampaigns analysis report
We can see that the campaign had two peaks - at the beginning and closer to the end of the 100-day period. Now let’s look at the posts that were responsible for the peaks:

Performed with with Diagnostic report
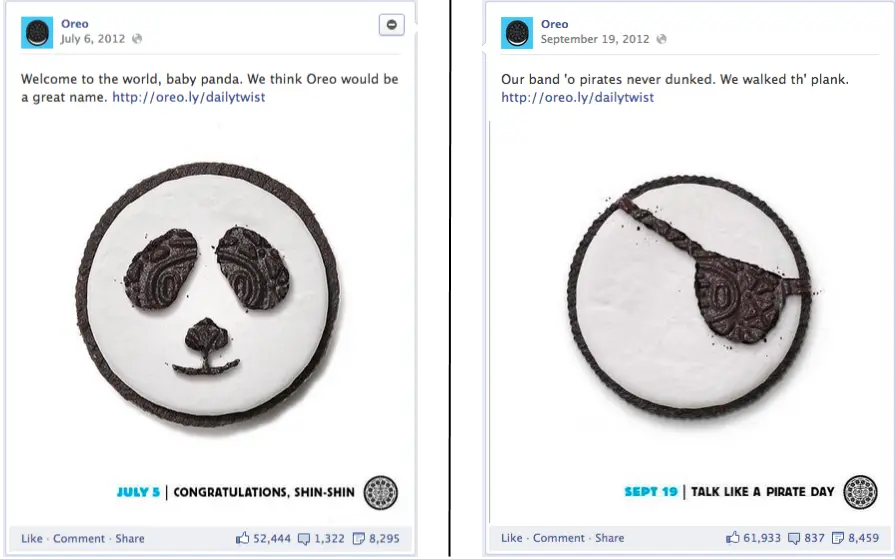
These peaks were caused by the two most successful posts of the Daily Twist - the Panda-post and the Pirate-post:
We can clearly see that the creative efforts of the Oreo team has paid off, but look at to what extent! It’s an amazing result for just 100 days:
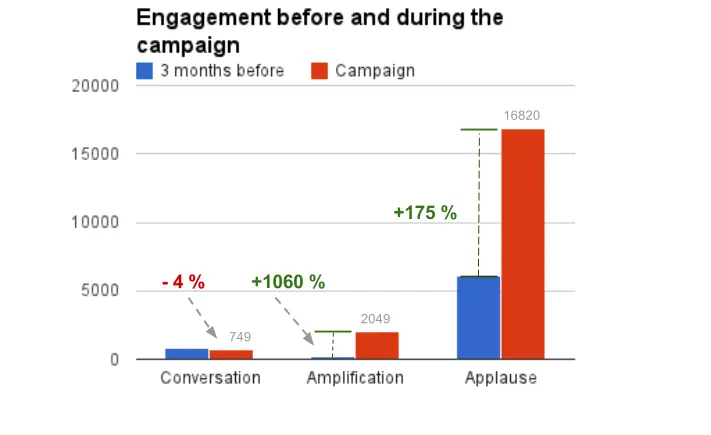
Look at these mind-blowing results - each post related to the campaign was shared 2,049 times on average, while before the campaign this number was only 176 times per post. And each Daily Twist post received 16,280 likes, previously it was only 6,000 likes per post on average.
The Daily Twist has caused the biggest increase in favorites (Applause rate) and shares (Amplification rate), but showed a slight decrease in comments (Conversation rate) compared to the 3-month period before the campaign. Such results are caused by the two main factors:
- Facebook is originally more biased towards generating Likes. The average proportion of Comments : Shares : Likes on Facebook is somewhere near 1 comment : 1 share : 10 likes (for the food industries, and a just bit different for other industries).
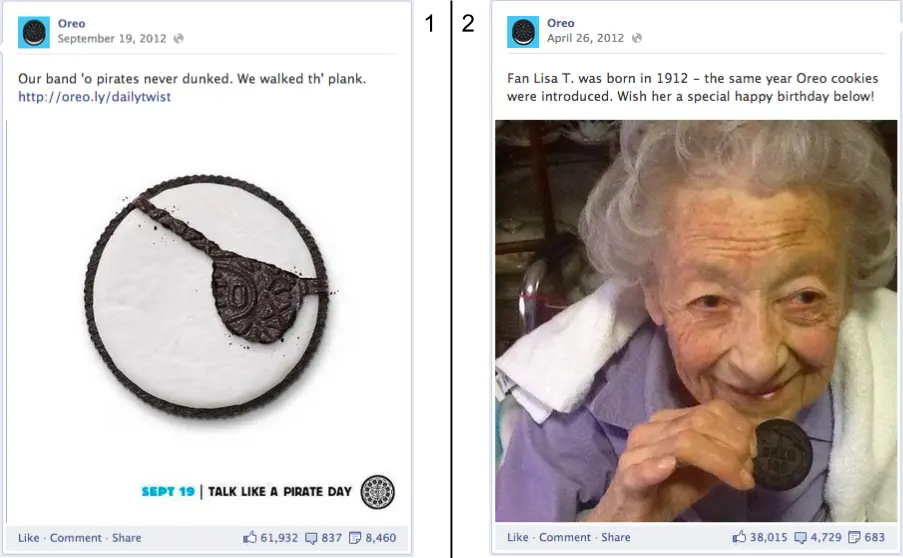
- The content of this campaign was focused more on Liking and Sharing than on starting a conversation. Compare one of the Daily Twist posts and the Oreo’s most commented post which doesn’t belong to the campaign period:
The second post has a clear call-to-action and an incentive to comment - “Wish her a special happy birthday below”. While the first post is more focused on promoting a campaign page, http://www.oreo.com/dailytwist/ and there is not much you can say about this post except that it’s really cool.
What is even more interesting - did Oreo live happily ever after the campaign? Were they able to increase the activity of their fans on their Facebook page in the long-term and benefit from gaining 1 million new fans? Looks like everything just went back to normal after the campaign. Except for that one peak in January 2013. Which was haphazardly caused by only one post. Yes, gaining new fans is only the first step; keeping them interested afterwards is what comes next.
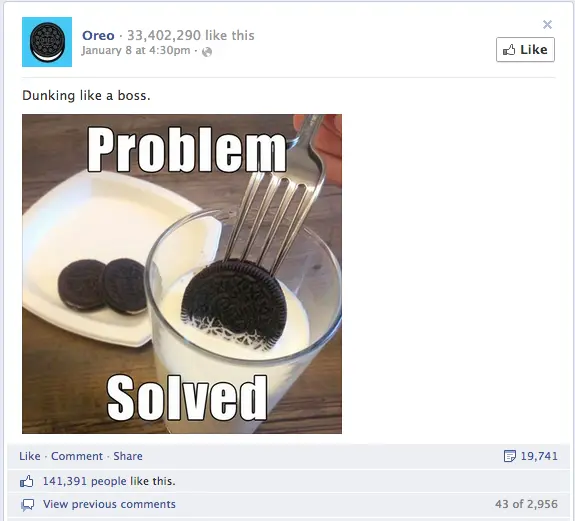
And here’s that epic January post:
141,391people liked it! Of course, who wouldn’t? It’s hilarious.
Obermutten - a little village goes global
Award: The Gold Award.
Duration:2012 year.
Description: The tiny village of Obermutten, Switzerland promised to everyone who liked their Facebook page to get his or her photo printed out and pinned to the Obermutten bulletin board in real life.
Results: The campaign reached 16,000 fans and their Facebook Page attracted 200 times more fans than Obermutten has inhabitants. The campaign reached 60,000 people due to press coverage (you can read more campaign details here)
Performed with with Trend report
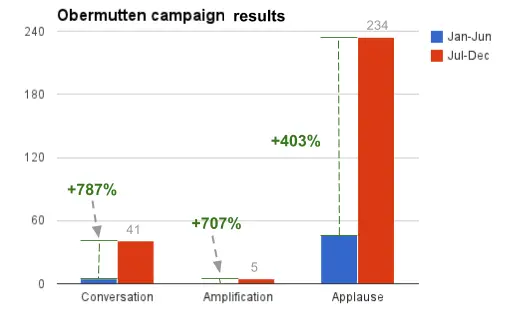
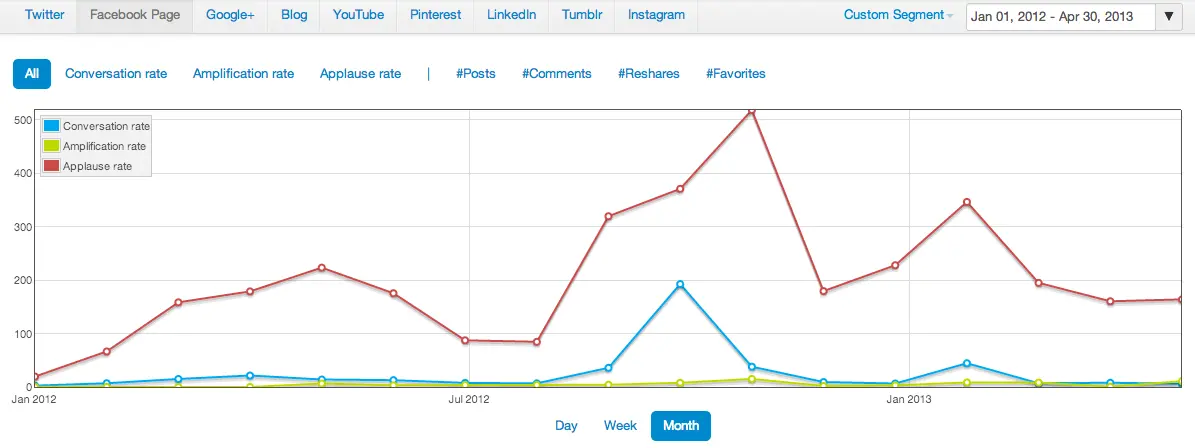
This admirable village managed to achieve incredible results for such a low budget campaign (10,000 CHF = 10,623 USD). Comparing the first half of the 2012 year to the second half, we can see how significantly increased the activity of Obermutten fans on their page became:
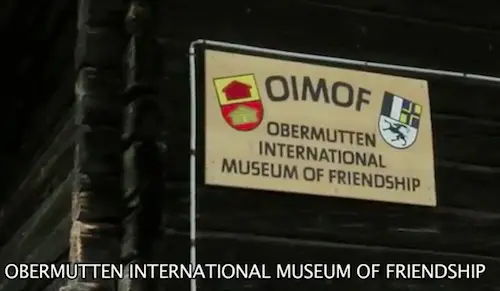
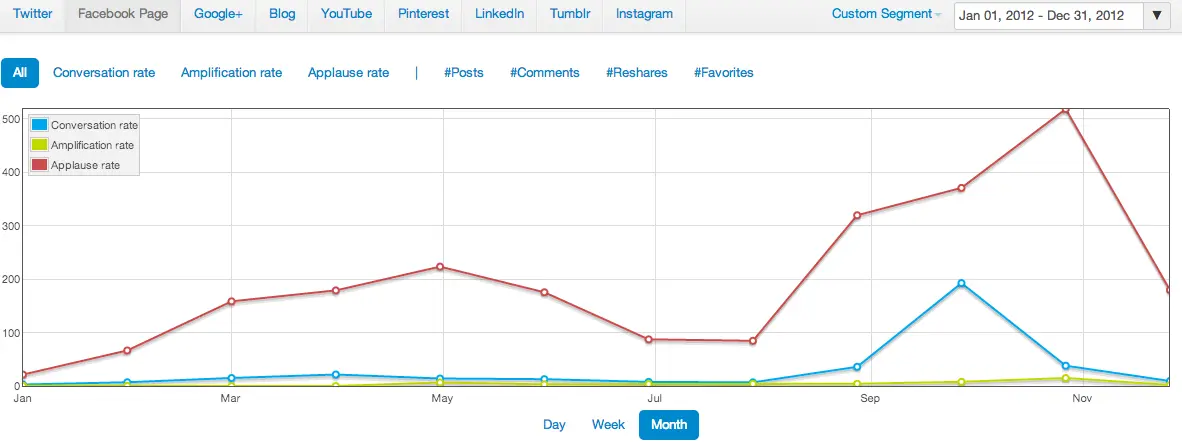
Among everything, one really amazing idea to learn from this campaign is the Obermutten International Museum Of Friendship (OIMOF), whereby all presents from fans are stored - turning intangible Likes into real life presents, appreciated by villagers. The idea was not only touching, but also resultative. Look how the activity on the page increased during the second half of the year when the museum was established and opened.
What is even more pleasing is that the Swiss village is still keeping a nice pace even after the active campaign. In the beginning of 2013 (Feb-May) it had a Conversation rate 3.3 times higher than at the beginning of 2012, Amplification rate 11 times higher and Applause rate 4.73 higher:
Performed with with Trend report
Not bad for a cosy little village, huh?
AirAsia Australia Friendsy
Award: The Silver Award.
Duration: Apr 10’12 - Jun 19’12.
Description: In April 2012 AirAsia launched into the very promising Australian hub, Sydney. And the goal of the Friendsy campaign was to increase load factor on each route ex Sydney to 80%. A Facebook App was created showing a virtual plane, which fans could fill with 300 of their friends. The winner’s plane would take everyone from Sydney to Kuala Lumpur to spend three nights in a luxury hotel paid for by AirAsia, and then home again on their private plane.
Results: The buzz, reaching even international news, generated PR value of $1,627,593! The AirAsia Facebook fan base grew by 30% and the Friendsy competition reached 2,291,483 people on Facebook (read full campaign description here).
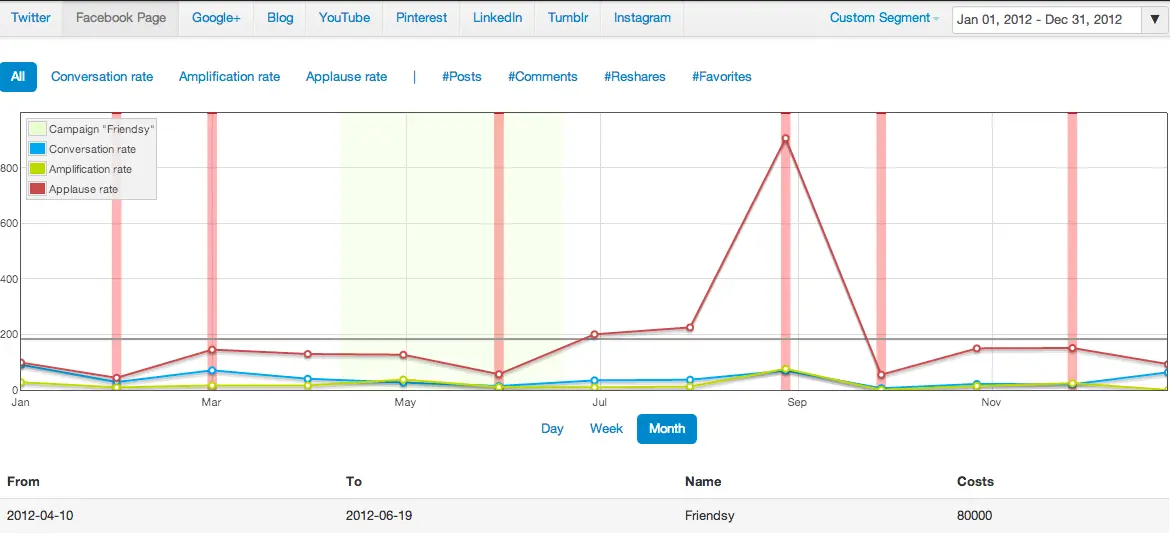
So here’s what happened on AirAsia’s Facebook page (the campaign period is highlighted yellowish as usual):
Performed with with Сampaigns analysis report
Surprise, surprise! No increase in activity on a page and there’s even a decrease. Here’s why: all activity during the campaign were happening in the Friendsy App, that’s why the page were left aside a bit. Still the campaign were astonishingly successful.
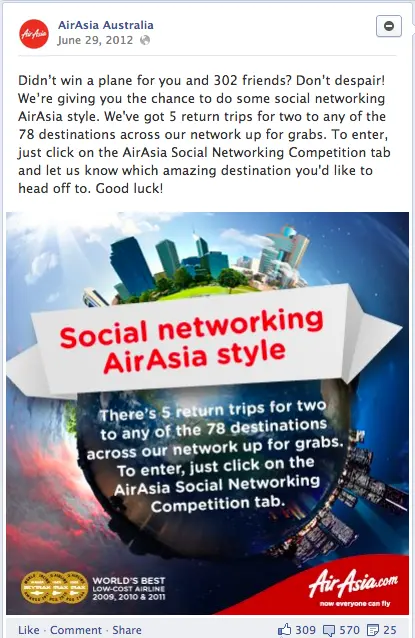
A great idea to learn from is what happened after the campaign. AirAsia picked up all those fans who participated in a competition but didn’t win the main prize by the next wave of competitions and sales. Just like the pie, piping hot straight out of the oven, fans were filled with competition boldness, still longing for some prize - a perfect audience for new contests. And it’s a good reparation for not winning the plane: “Didn’t win a plane for you and 302 friends? Don’t despair...”
Nice move.
One more lesson we can learn from this case - stay focused on your business goals, not the number of Likes. Even if AirAsia’s page didn’t show any increase in engagement and even if their App was super viral. What really matters is that AirAsia Australia planes have reached an average 82.5% load factor on all ex Sydney routes. Which is an unprecedented result for an AirAsia route launch. In addition, they are on track to move to double daily flights ex Sydney from mid-2013.
Ok, I think I’ll go now book an AirAsia flight to Obermutten, hope they serve Oreo on board :)
When you’re ready to rock your social media analytics
give TrueSocialMetrics a try!
Start Trial
No credit card required.
