Lesson 3.2.
Posts Effectiveness Analysis
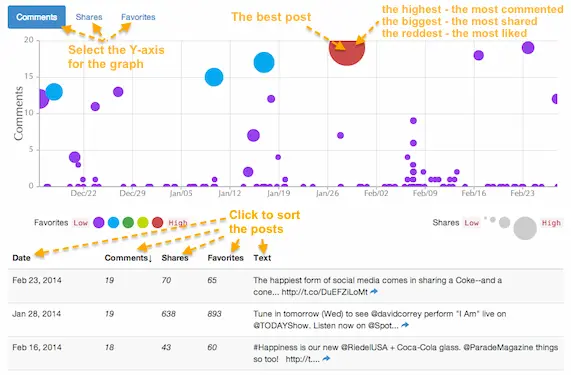
Use the Diagnostic report to find out which topics are the best at engaging your followers. That is, which topics are triggering a conversation, or are more likely to be shared or favorited. This reveals how each piece of content performed compared to the average results of your social media page.
To analyze the graph, use the ‘Sun rule’: the best posts are red, big and high.
- Analyze the posts from your Social Media Campaigns
- Evaluate your Content Strategy Consistency in comparison with your competitors' content.
- Use Content Segmentation to find the most effective content tactics.
Analyze Campaign posts
Use Custom Segments feature to isolate your Campaign posts or simply select the long date range which includes the period of your Social Media Campaign to analyze the Effectiveness of the Campaign Posts.
In this example Oreo’s Facebook Daily Twist Campaign lasts 100 days - 25 Jun’12 - 2 Oct’12, we used a year-long timeframe for analysis - Apr 1’ 12 till Jan 31’ 13. We can see that campaign had two peaks - at the beginning and closer to the end of the 100-days period. And we can instantly find the best performing posts of the Campaign and see by how exactly they are better than average posts for that period.
Read the full case study: Analyzing The Best Facebook Campaigns
Compare Top Competitors’ posts
One more great example is to analyze top Competitors’ or Industry leaders’ posts to find the winning patterns - type of the content, topics, creative tactics etc.
In this example, among top Soda Brands the best tweets In absolute numbers belong to Coca-Cola and Pepsi. The most Favorited Pepsi-tweet features a contest with a chance to win tickets to Beyonce’s show in NYC. The most Viral and Commented tweet nomination is monopolized by Coke, presenting a positive viral video about the power of a smile.
Read the full case study: Soda wars
Compare Top Competitors’ posts
But taking into account different size of the accounts, which means the different number of followers, it is also wise to calculate the winner in relative terms per 1 follower. So here are the best performing Soda tweets in relative terms per follower:


The Most Viral tweet belongs to Mountain Dew: it informs the fans about the epic comeback of their favorite flavour.
The Most Favorited tweet was also made by Mountain, featuring their awesome promo videos.
The most Commented tweet was written by Dr Pepper and includes a contest with a cool branded one-can-mini-fridge.
Based on relative and absolute results, it looks like contests and creative videos are a good receipt for top tweets.
Read the full case study: Soda wars
Industry Benchmark for Posts
One more great way to compare social media performance is using benchmarking - an industry standard. Which helps to understand brand’s social media performance in the context of the overall market.
Average Soda brand profile Conversation rate: 3 replies/tweet Amplification rate: 30 retweets/tweet Applause rate: Posting density: #Fans: 19 favorites/tweet 71 tweets/month 576,246 fans
Read the full case study: Soda wars
Analyze Communities
For community owners per post activity is a useful thing to analyze to reward the best performers - e.g. the Best Post of the Month Award and so on. Which will definitely increase community participants’ motivation and help to understand which topics do they prefer. This one is from Social Media community:
Notice the interesting pattern of posting activity, this winning message was the only one posted on Sunday (Apr 7) and was fully rewarded with higher response.
Use Segmentation
With the help of Custom Segments feature you can isolate and analyze all non-viral posts, super viral posts, most commented etc. to discover the similar patterns inside the segments to improve your posts in the future. Which topic and type of a content doesn’t get retweeted? Which phrase or idea stimulates followers to actively comment on your post?

Read how to use Custom Segments: Custom Segments
Additional info:- How to use Custom Segments


