The best way to evaluate your performance is to compare it with your competitors’. You can do it easily at TrueSocialMetrics because no login credentials are required to connect competitors’ social media pages. Compare your results against your competitors, analyze their posting strategy, social media campaigns and seize their best practices.
You can select unlimited (depends on your subscription type) number of accounts to compare simultaneously and there are 2 reporting views you can switch to:
- Average - an average result, calculated as the average value for all metrics among the accounts you have included in the report.
- Maximum - the best result, calculated as the maximum value of metrics among the accounts included in the report.
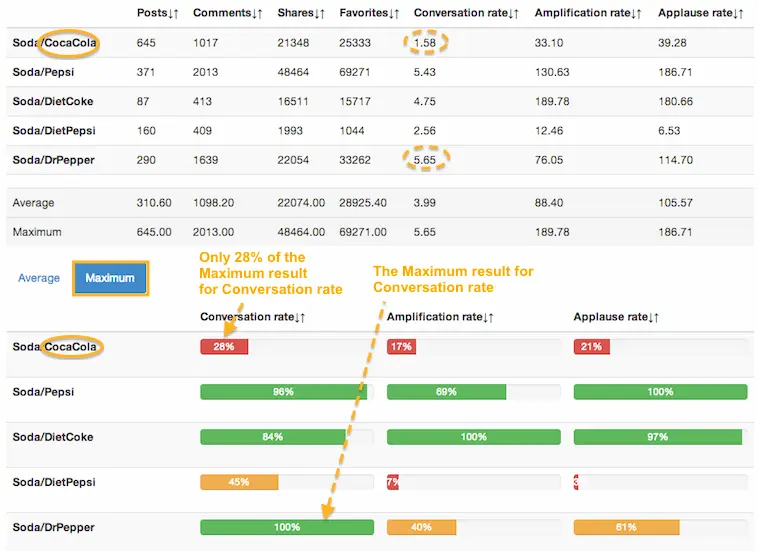
For example, the screenshot below shows that Coca Cola has reached only 23% of the maximum possible result for Conversation rate on Twitter, based on the results from Coca Cola and 4 of their top competitors’ results (Maximum tab).

As for the Average tab, it shows how your and competitors’ accounts are performing compared to the average results. Here, 100% is the average value, and for example, 50% would indicate that your results are half that of the average among selected accounts.
Useful tips on how to use Competitors section reports:
- Compare the general performance of the accounts.
- Analyze the Best and Worst content for posts ideas.
- Analyze the Posting Density to find an optimal posting strategy.
- Compare the Followers Quality.
- Use Competitros lists to analyze account in different contexts.
Case Studies:
DoubleTree Hotels on Facebook: Benchmarking from Fellow-brands
How Competitive Analysis helped DoubleTree Hotels benchmark effective content tactics from it's competitors, sister-brands, and fellow-brands from the same hotel chain.
- How do I connect a social media account if I don't know its login credentials?
- How can I add more brands/competitors to analyze?
- Why are my figures different from what I see in my social media account?
- What is the 'Untitled' account?
How do I connect a social media account if I don't know its login credentials?
You don’t need to know any login credentials to do this, all you need to know is the link to social media profiles. You can even connect your competitors' accounts.
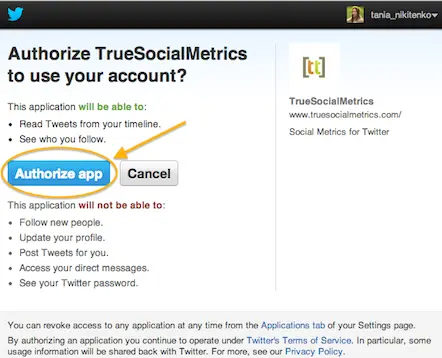
Note: when you connect a social media account for Twitter, YouTube, or Tumblr, you will be asked to authorize TrueSocialMetrics for read-only access to your account (we can't post anything from your Twitter account). This is necessary to provide TrueSocialMetrics with access to APIs for these social networks. It will use your personal account login credentials, not the credentials of the analyzed account.

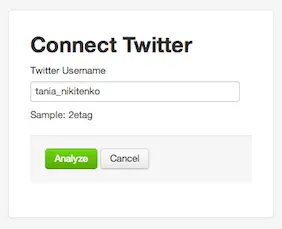
After you click the ‘Authorize app’/‘Grant access’/‘Allow’ button, you will be redirected to a form where you will then need to input the account link or Twitter handle of the account you wish to analyze. That’s all you need to do. You don’t need to know any login credentials.
How can I add more brands/competitors to analyze?
Here's a quick tutorial on "How to add more brands/competitors".
Why are my figures different from what I see in my social media account?
For some social networks (Blog, YouTube, Linkedin, Tumblr, Instagram, Slideshare, Vimeo) we additionally collect data from other places besides the channel (e.g., Disqus, Delicious, StumbleUpon, Reddit, Digg).
You can find out where each metric was collected from at the All Posts report:

Read more about data collection sources here.
What is the 'Untitled' account?
It's just the name of the first created account in your accounts list. You can rename it in Settings->Account page.
Amplification rate - indicates how many times on average each of your posts was Shared/Retweeted (e.g. Amplification rate = 5 means that each of your posts was shared 5 times on average).
Amplification rate = # of Shares/ # of Posts
Conversation rate indicates how many Comments/Replies on average each of your posts has received (e.g. Conversation rate = 5 means each of your posts has an average of 5 comments).
Conversation rate = # of Comments/ # of Posts
Applause rate - indicates how many Likes/Likes each of your posts has received on average (e.g. Applause rate = 5 means each of your posts has an average of 5 Likes).
Applause rate = # of Likes/ # of Posts
Economic value shows how much Economic Value each visit from a social network brings to your site by completing your site goals (e.g. Economic value = $5 means that each visit from this social media site brings your business $5 in value).
Economic value = Per session Goal Value from each Social Network (obtained from Google Analytics)
Terminology
| Posts | Comments | Shares | Likes | |
|---|---|---|---|---|
| # of tweets | replies, @username (counted as replies) | retweets, RT/CC/via | likes | |
| # of posts | comments | shares | likes | |
| Blog | # of posts | comments* | shares* | likes* |
| YouTube | # of videos | comments* | shares* | likes |
| # of updates | comments | shares* | likes* | |
| Tumblr | # of blogs | notes* | reblogs* | hearts* |
| # of posts | comments* | embed* | hearts* | |
| Slideshare | # of presentations | comments | shares* | likes* |
| Vimeo | # of videos | comments* | shares* | likes* |
- additionally collects data from other places besides the channel (e.g., Disqus, Delicious, StumbleUpon, Reddit, Digg)

