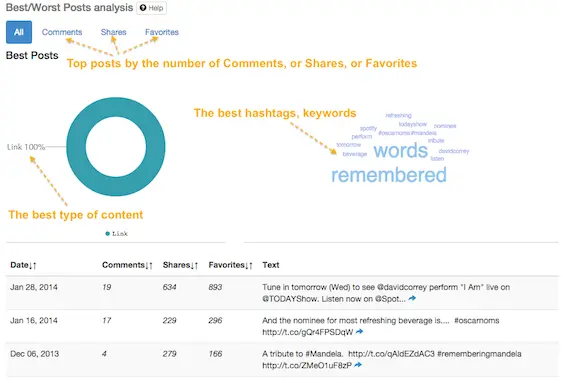
Analyze your best and worst posts. Discover which types of content perform the best - videos, links, pictures or text. Uncover the best and the worst topics and keywords for successful posts.
- Discover the similar patterns for the most effective and the least effective posts.
- Compare the tactics of your top posts and competitors’ best posts.
- Get ideas about popular hashtags, keywords for new posts.
Why are my figures different from what I see in my social media account?
For some social networks (Blog, YouTube, Linkedin, Tumblr, Instagram, Slideshare, Vimeo) we additionally collect data from other places besides the channel (e.g., Disqus, Delicious, StumbleUpon, Reddit, Digg).
You can find out where each metric was collected from at the All Posts report:

Read more about data collection sources here.
How do you calculate Shares for Instagram?
Shares for Instagram are calculated as the number of times the link to your Instagram post was shared on other social sharing sites: Pinterest, StumbleUpon, Reddit, Digg, Twitter, Facebook, Linkedin.
For some social networks (Blog, YouTube, Linkedin, Tumblr, Instagram, Slideshare, Vimeo) we additionally collect data from other places besides the channel (e.g., Disqus, Delicious, StumbleUpon, Reddit, Digg).
Read more about data collection sources here.
Terminology
| Posts | Comments | Shares | Likes | |
|---|---|---|---|---|
| # of tweets | replies, @username (counted as replies) | retweets, RT/CC/via | likes | |
| # of posts | comments | shares | likes | |
| Blog | # of posts | comments* | shares* | likes* |
| YouTube | # of videos | comments* | shares* | likes |
| # of updates | comments | shares* | likes* | |
| Tumblr | # of blogs | notes* | reblogs* | hearts* |
| # of posts | comments* | embed* | hearts* | |
| Slideshare | # of presentations | comments | shares* | likes* |
| Vimeo | # of videos | comments* | shares* | likes* |
- additionally collects data from other places besides the channel (e.g., Disqus, Delicious, StumbleUpon, Reddit, Digg)
