Segment your data and compare different segments to find out which type of content is the most engaging for your followers.
Are retweets less engaging than your own content? Are posts of a particular topic more effective than others? Was your social media campaign more successful than your usual content, and by how much?
Use Content Segmentation report to:
- Analyze whether your Social Media Campaigns were more successful than your Usual Content, and by how much.
- Discover if Retweets are less engaging than your Own Content.
- Find out if posts of a particular topic are more effective than others.
- Analyze what type of content is the most effective: pictures, links, videos or plain text.
E.g. if you have a Twitter campaign using the hashtag #ShowYourHeart, you can create a segment with that hashtag and analyze the campaign’s posts performance on the All Posts page. Applying a segment on the Audience page, you will see the most active participants of the campaign. And so on.
Learn how to manage and create custom segments here.
Case Studies:
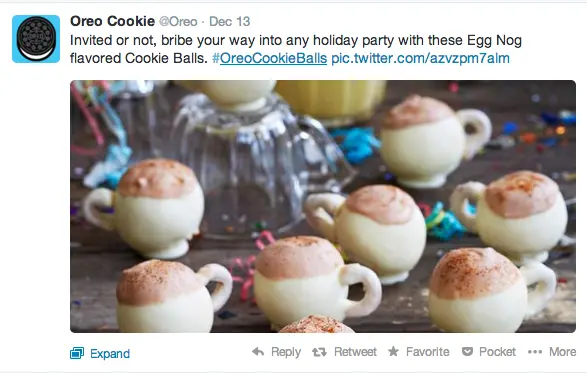
How Oreo Rocks in Twitter: Using Content Segmentation for Tweets Analysis
How to analyze Campaings and all content with Custom Segmentation.
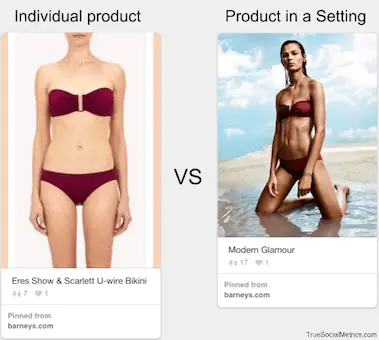
The Most Viral Type of Pins: Barney’s on Pinterest
Analyzing the effectiveness of different types of pins with Content Segmentation feature for apparel retailer on Pinterest.
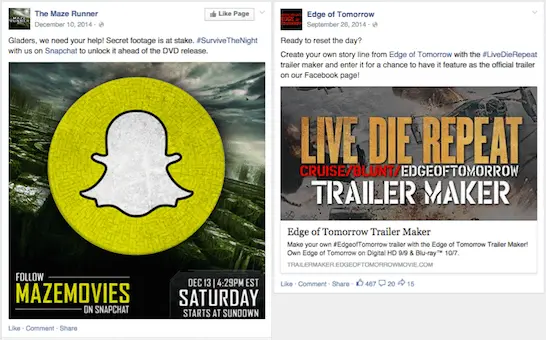
Movies on Facebook: Creative Ways to Promote DVD Releases
Using the Content Segmentation feature to analyze Facebook posts promoting DVD/HD/Blu-ray releases for the best movies of 2014.
How do you calculate Shares for Instagram?
Shares for Instagram are calculated as the number of times the link to your Instagram post was shared on other social sharing sites: Pinterest, StumbleUpon, Reddit, Digg, Twitter, Facebook, Linkedin.
For some social networks (Blog, YouTube, Linkedin, Tumblr, Instagram, Slideshare, Vimeo) we additionally collect data from other places besides the channel (e.g., Disqus, Delicious, StumbleUpon, Reddit, Digg).
Read more about data collection sources here.
Amplification rate - indicates how many times on average each of your posts was Shared/Retweeted (e.g. Amplification rate = 5 means that each of your posts was shared 5 times on average).
Amplification rate = # of Shares/ # of Posts
Conversation rate indicates how many Comments/Replies on average each of your posts has received (e.g. Conversation rate = 5 means each of your posts has an average of 5 comments).
Conversation rate = # of Comments/ # of Posts
Applause rate - indicates how many Likes/Likes each of your posts has received on average (e.g. Applause rate = 5 means each of your posts has an average of 5 Likes).
Applause rate = # of Likes/ # of Posts
Terminology
| Posts | Comments | Shares | Likes | |
|---|---|---|---|---|
| # of tweets | replies, @username (counted as replies) | retweets, RT/CC/via | likes | |
| # of posts | comments | shares | likes | |
| Blog | # of posts | comments* | shares* | likes* |
| YouTube | # of videos | comments* | shares* | likes |
| # of updates | comments | shares* | likes* | |
| Tumblr | # of blogs | notes* | reblogs* | hearts* |
| # of posts | comments* | embed* | hearts* | |
| Slideshare | # of presentations | comments | shares* | likes* |
| Vimeo | # of videos | comments* | shares* | likes* |
- additionally collects data from other places besides the channel (e.g., Disqus, Delicious, StumbleUpon, Reddit, Digg)


